NCL Home>
Application examples>
Maps and map projections ||
Data files for some examples
 sat_1.ncl:
Creates a dramatic plot of sea level pressure over a satellite view
of the earth with H and L labels.
sat_1.ncl:
Creates a dramatic plot of sea level pressure over a satellite view
of the earth with H and L labels.
 sat_2.ncl: This second is very similar
to the first example except that some shading has been added to
emphasize the high pressure areas.
sat_2.ncl: This second is very similar
to the first example except that some shading has been added to
emphasize the high pressure areas.
 sat_3.ncl: Example of how to zoom in
on a satellite projection plus a demonstration of the new automatic
tickmarks.
sat_3.ncl: Example of how to zoom in
on a satellite projection plus a demonstration of the new automatic
tickmarks.
 mask_6.ncl: This example shows how to
use the "Angles" value for mpLimitMode,
along with mpSatelliteAngle1F
and mpSatelliteAngle2F
to zoom in on a satellite projection.
mask_6.ncl: This example shows how to
use the "Angles" value for mpLimitMode,
along with mpSatelliteAngle1F
and mpSatelliteAngle2F
to zoom in on a satellite projection.
Example pages containing: tips | resources | functions/procedures
NCL Graphics: Satellite Projections
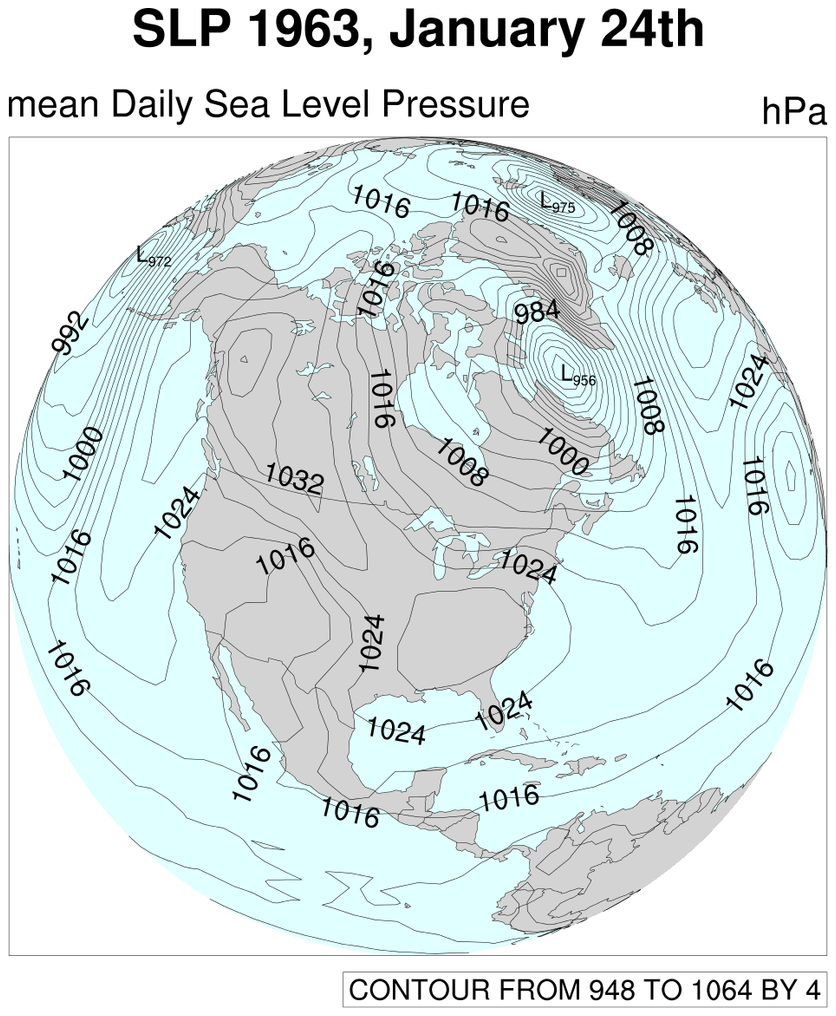
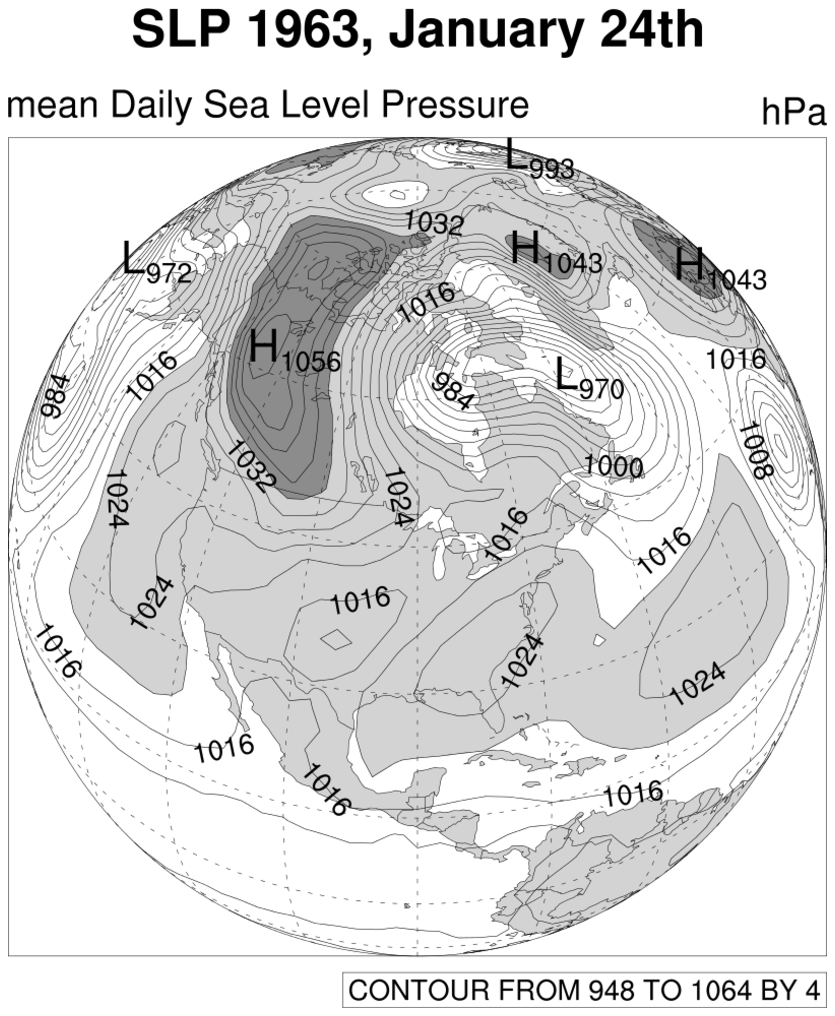
sat_1.ncl:
Creates a dramatic plot of sea level pressure over a satellite view
of the earth with H and L labels.
cnHighLabelsOn = True
cnHighLabelFontHeightF = 0.024
cnHighLabelBackgroundColor = -1
Turns on High labels, controls their font size and background color.
For Low labels, just swap out High for Low.
cnLabelDrawOrder, Draws the contour info labels on top of the contour lines. Since the labels in these plots have white backgrounds, this is very useful.
mpProjection = "satellite", Selects the map projection. There are other projections to choose from.
mpSatelliteDistF=3.0, This resource specifies the distance in multiples of the earth's radius of the satellite at the view origin. If the value is 1.0 or less, the satellite projection is replaced by its limiting case: an orthographic projection. The default is 1.0.
mpOutlineBoundarySets ="National", Adds country boundaries to the continental outlines. There are other types of outlines to choose from.
mpGridLineDashPattern = 2, Changes the lat/lon lines to dash.
A Python version of this projection is available here.
 sat_2.ncl: This second is very similar
to the first example except that some shading has been added to
emphasize the high pressure areas.
sat_2.ncl: This second is very similar
to the first example except that some shading has been added to
emphasize the high pressure areas.
A Python version of this projection is available here.
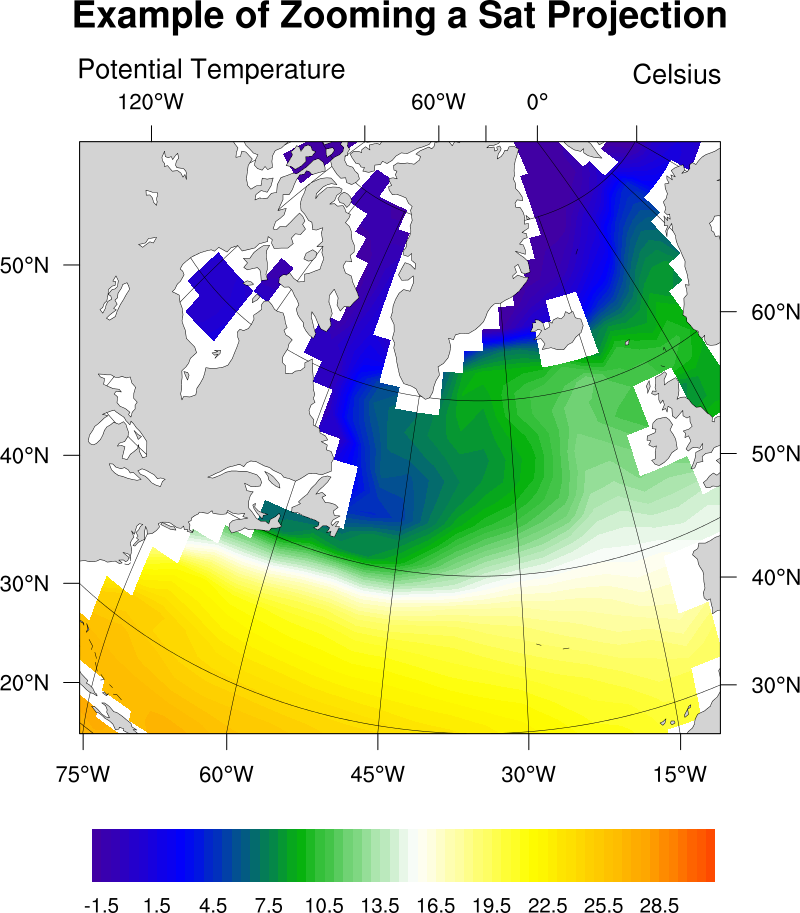 sat_3.ncl: Example of how to zoom in
on a satellite projection plus a demonstration of the new automatic
tickmarks.
sat_3.ncl: Example of how to zoom in
on a satellite projection plus a demonstration of the new automatic
tickmarks.
In order to zoom in on a region the four resources
mpMinLatF,
mpMaxLatF, mpMinLonF, and
mpMaxLonF must be set. The thing to
remember, is that mpLimitMode must
also be set to "LatLon". The csm cylindrical equidistant and polar
stereographic plot templates set this resource for you, so it is easy
to overlook.
pmTickMarkDisplayMode = "Always", will turn on the automatic lat/lon labels. This is primarily useful for projections other than cylindrical equidistant and polar stereographic which have been given their own style of lat/lon labels by the csm plot templates.
mpGridAndLimbOn = True, turns on the lat/lon grid which was turned off by the plot template.
mpGridMaskMode = "MaskLand", will mask the grid over land so that it is only visible over water.
A Python version of this projection is available here.
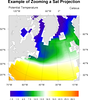
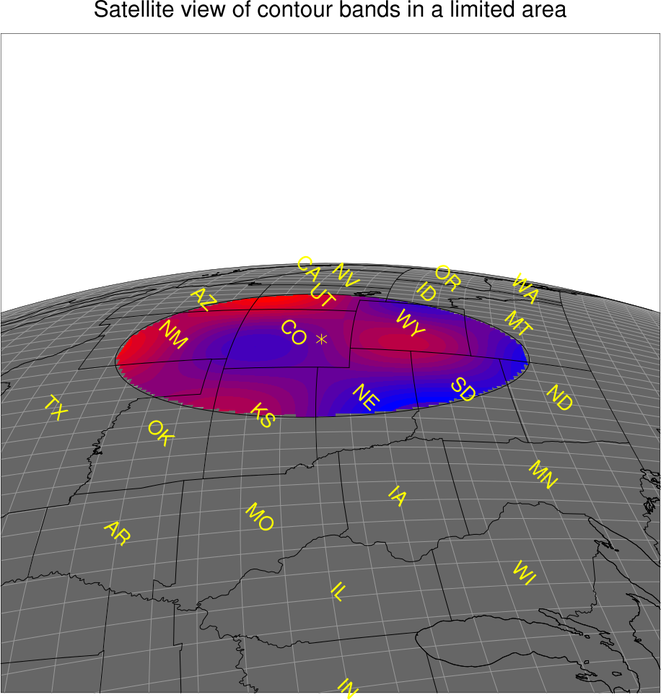 mask_6.ncl: This example shows how to
use the "Angles" value for mpLimitMode,
along with mpSatelliteAngle1F
and mpSatelliteAngle2F
to zoom in on a satellite projection.
mask_6.ncl: This example shows how to
use the "Angles" value for mpLimitMode,
along with mpSatelliteAngle1F
and mpSatelliteAngle2F
to zoom in on a satellite projection.