NCL Home>
Application examples>
Plot techniques ||
Data files for some examples
 weather_sym_1.ncl:
This example shows how to draw a single point of station model data
using the built-in procedure wmstnm. The parameter
setting routine wmsetp is used to set the size of
the wind barb shaft.
weather_sym_1.ncl:
This example shows how to draw a single point of station model data
using the built-in procedure wmstnm. The parameter
setting routine wmsetp is used to set the size of
the wind barb shaft.
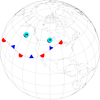
 weather_sym_3.ncl:
This example shows how to draw wind barbs over an orthographic map
projection using the wmbarbmap procedure.
weather_sym_3.ncl:
This example shows how to draw wind barbs over an orthographic map
projection using the wmbarbmap procedure.
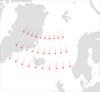
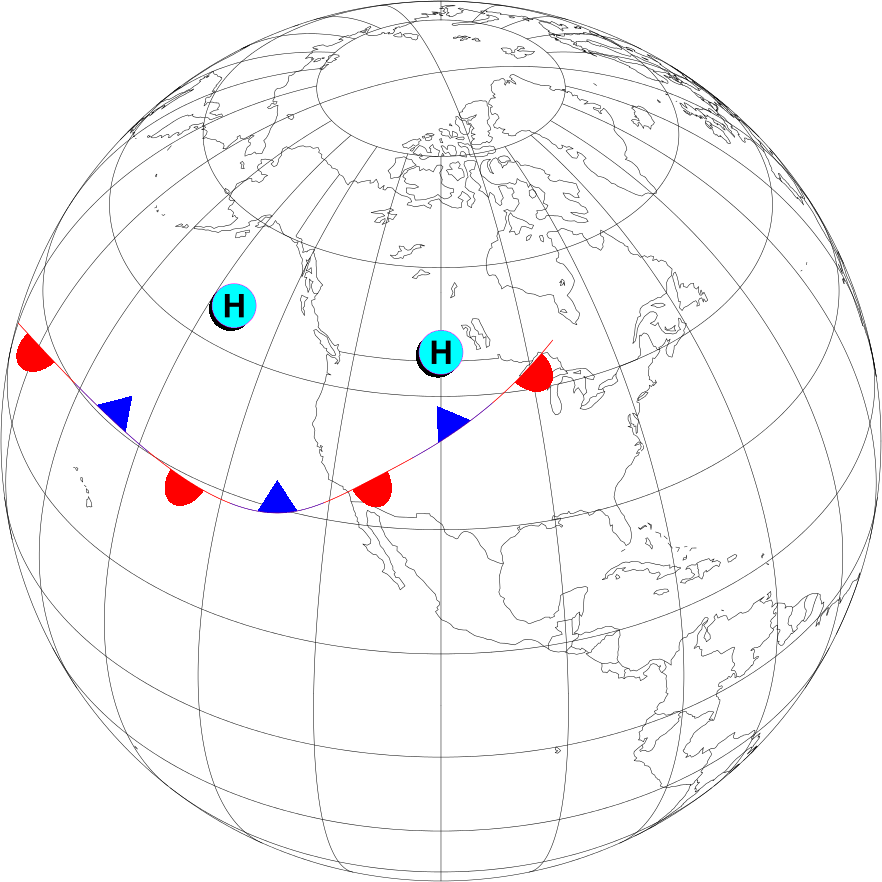
 weather_sym_4.ncl:
This example shows how to draw a weather front and a couple of "High"
symbols on a satellite view map projection using the
wmdrft and wmlabs procedures.
Note that you need to set the EZF parameter to 1 (via the
wmsetp procedure) to indicate that you are drawing
this over a map.
weather_sym_4.ncl:
This example shows how to draw a weather front and a couple of "High"
symbols on a satellite view map projection using the
wmdrft and wmlabs procedures.
Note that you need to set the EZF parameter to 1 (via the
wmsetp procedure) to indicate that you are drawing
this over a map.
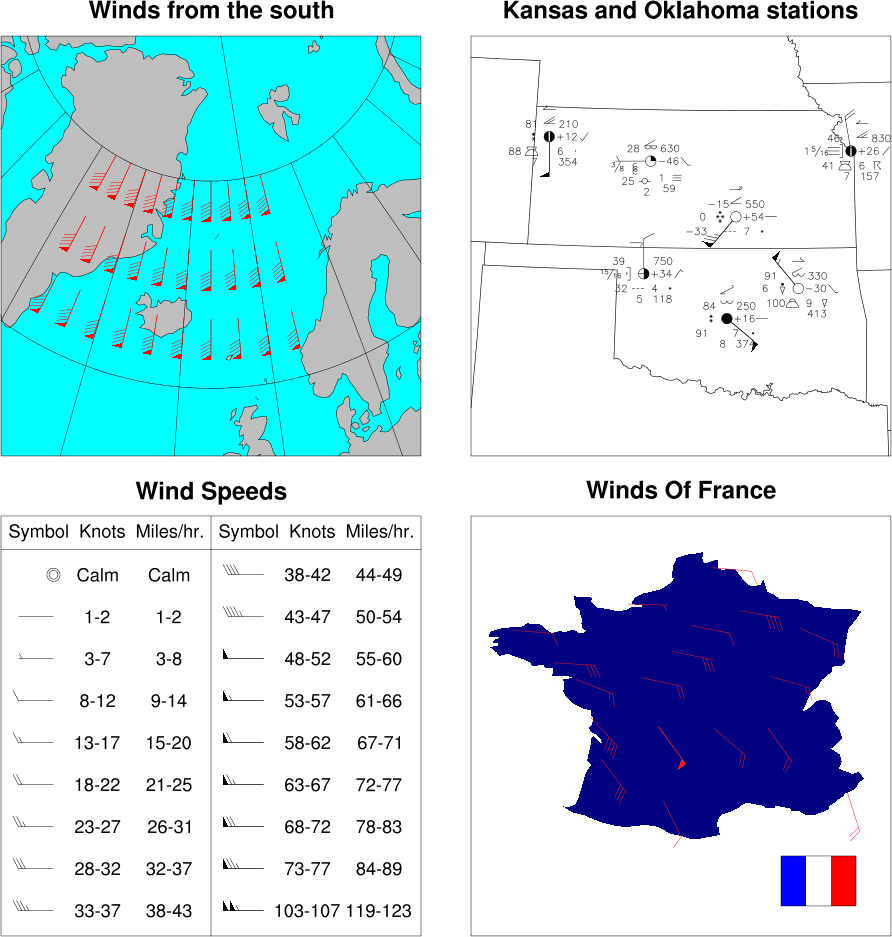
 weather_sym_5.ncl:
This example shows how to panel a series of plots that use
wmbarb, wmbarbmap,
and wmstnm.
weather_sym_5.ncl:
This example shows how to panel a series of plots that use
wmbarb, wmbarbmap,
and wmstnm.
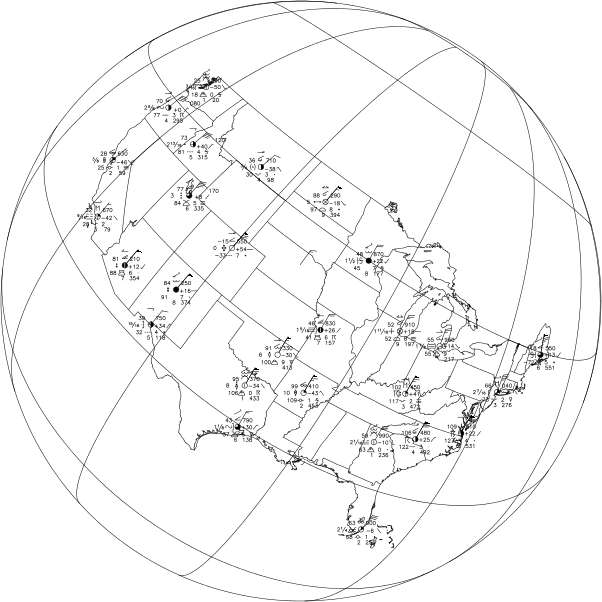
 weather_sym_6.ncl:
This example illustrates plotting station model data over
a map using wmstnm. It shows how the
windbarb directions are adjusted for the map projection.
weather_sym_6.ncl:
This example illustrates plotting station model data over
a map using wmstnm. It shows how the
windbarb directions are adjusted for the map projection.
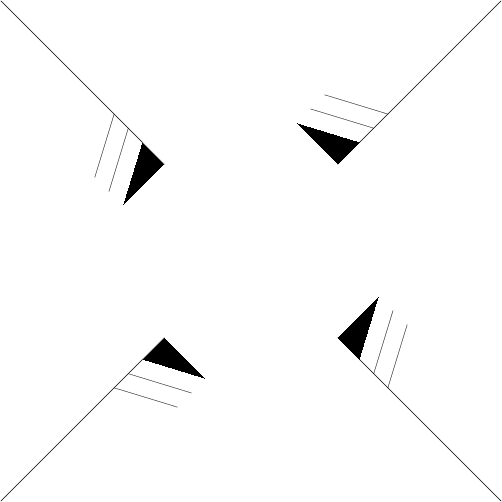
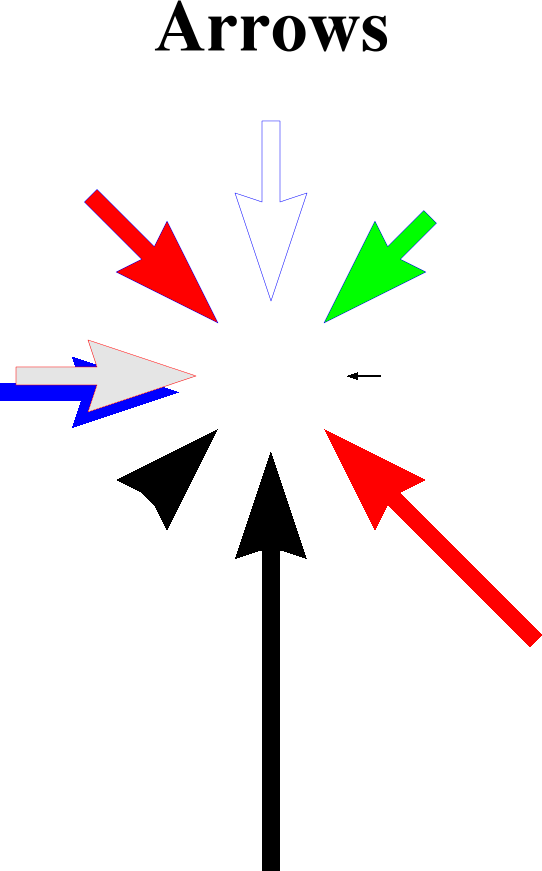
 weather_sym_7.ncl:
This example illustrates drawing arrows with different styles,
using wmlabs to draw the arrows, and
wmsetp to set attributes of the arrows.
weather_sym_7.ncl:
This example illustrates drawing arrows with different styles,
using wmlabs to draw the arrows, and
wmsetp to set attributes of the arrows.
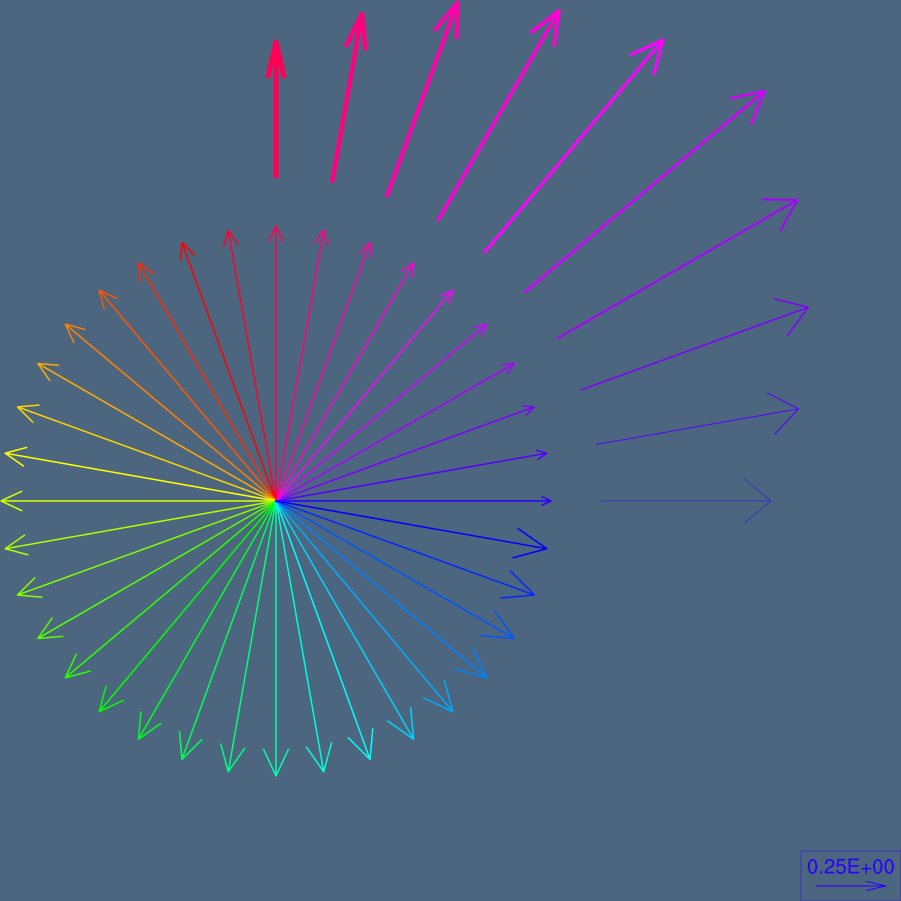
 weather_sym_8.ncl:
This example illustrates drawing vectors with different attributes
using wmvect to draw the vectors,
wmsetp to set the attributes, and
wmvlbl to draw an informational label box.
weather_sym_8.ncl:
This example illustrates drawing vectors with different attributes
using wmvect to draw the vectors,
wmsetp to set the attributes, and
wmvlbl to draw an informational label box.
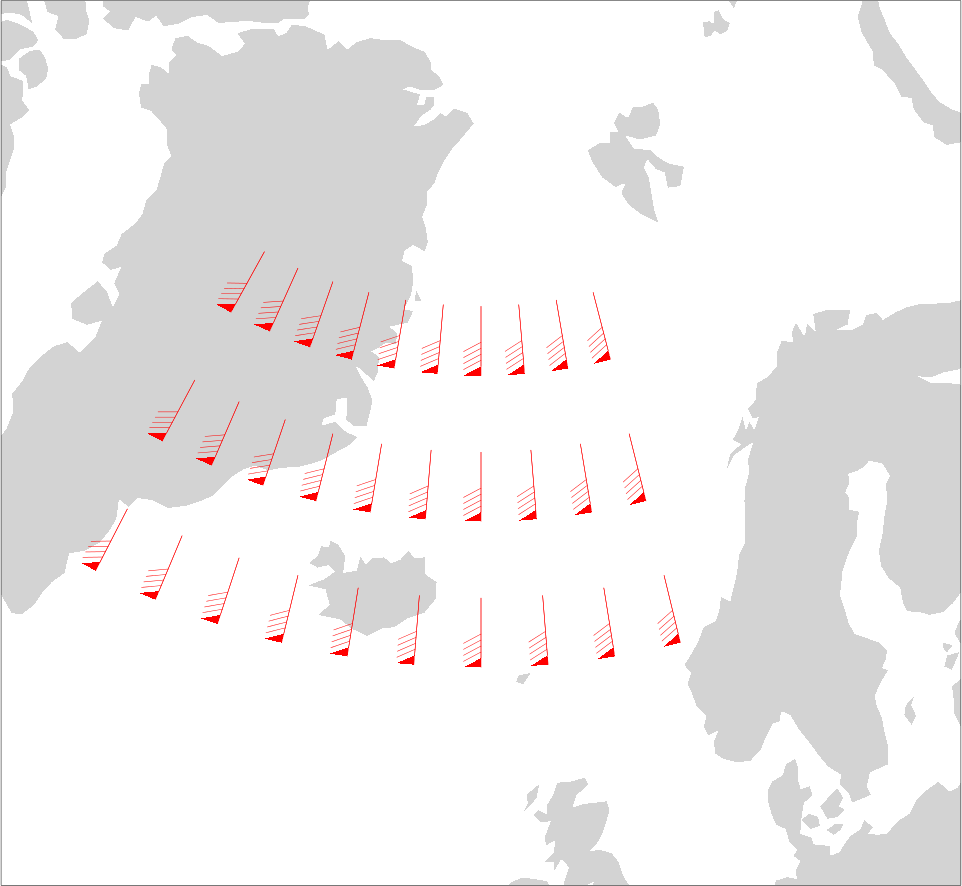
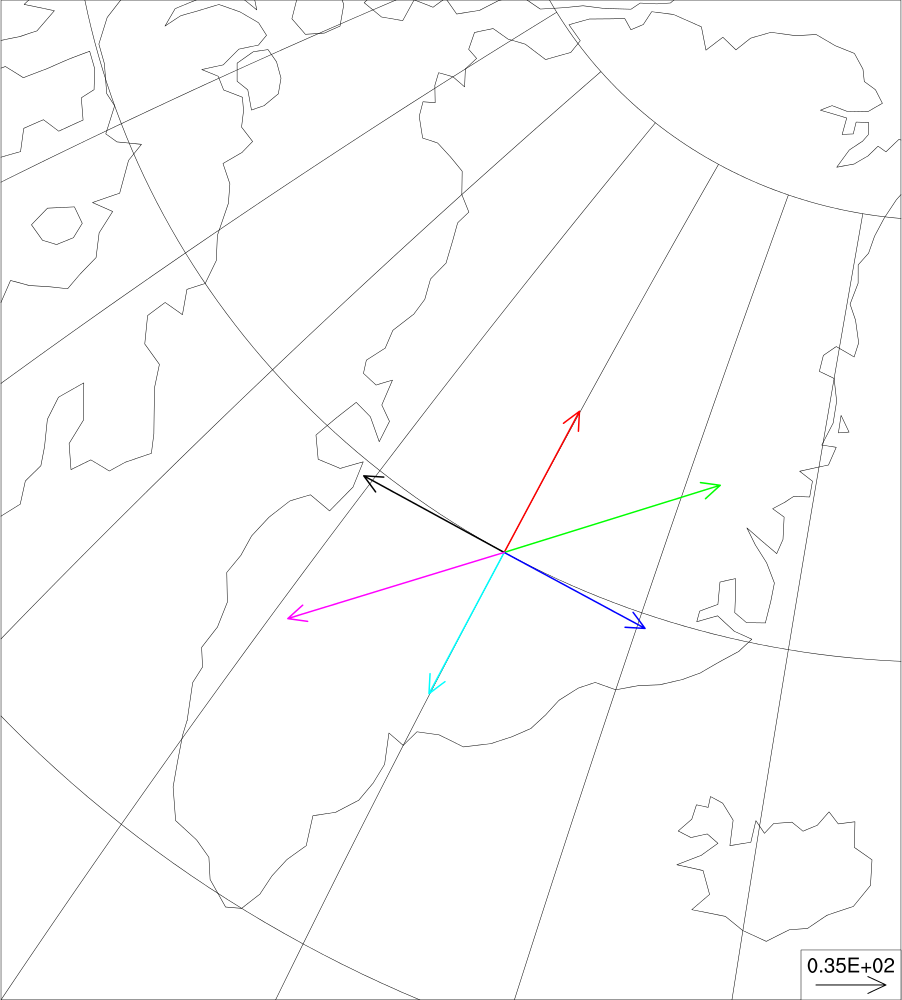
 weather_sym_9.ncl:
This example illustrates drawing vectors over a map
using wmvectmap to draw the vectors,
wmsetp to set the attributes, and
wmvlbl to draw an informational label box.
weather_sym_9.ncl:
This example illustrates drawing vectors over a map
using wmvectmap to draw the vectors,
wmsetp to set the attributes, and
wmvlbl to draw an informational label box.
Example pages containing:
tips |
resources |
functions/procedures
NCL: Weather symbols
This page shows how to draw various weather symbols using a suite of
weather map procedures.
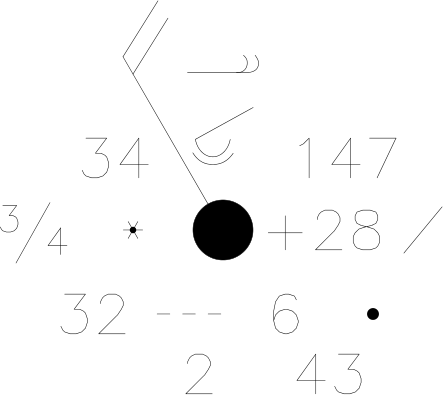
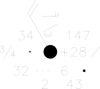
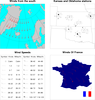
weather_sym_1.ncl:
This example shows how to draw a single point of station model data
using the built-in procedure wmstnm. The parameter
setting routine wmsetp is used to set the size of
the wind barb shaft.
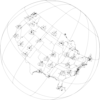
 weather_sym_3.ncl:
This example shows how to draw wind barbs over an orthographic map
projection using the wmbarbmap procedure.
weather_sym_3.ncl:
This example shows how to draw wind barbs over an orthographic map
projection using the wmbarbmap procedure.
 weather_sym_4.ncl:
This example shows how to draw a weather front and a couple of "High"
symbols on a satellite view map projection using the
wmdrft and wmlabs procedures.
Note that you need to set the EZF parameter to 1 (via the
wmsetp procedure) to indicate that you are drawing
this over a map.
weather_sym_4.ncl:
This example shows how to draw a weather front and a couple of "High"
symbols on a satellite view map projection using the
wmdrft and wmlabs procedures.
Note that you need to set the EZF parameter to 1 (via the
wmsetp procedure) to indicate that you are drawing
this over a map.
 weather_sym_5.ncl:
This example shows how to panel a series of plots that use
wmbarb, wmbarbmap,
and wmstnm.
weather_sym_5.ncl:
This example shows how to panel a series of plots that use
wmbarb, wmbarbmap,
and wmstnm.
 weather_sym_6.ncl:
This example illustrates plotting station model data over
a map using wmstnm. It shows how the
windbarb directions are adjusted for the map projection.
weather_sym_6.ncl:
This example illustrates plotting station model data over
a map using wmstnm. It shows how the
windbarb directions are adjusted for the map projection.
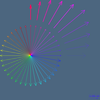
 weather_sym_7.ncl:
This example illustrates drawing arrows with different styles,
using wmlabs to draw the arrows, and
wmsetp to set attributes of the arrows.
weather_sym_7.ncl:
This example illustrates drawing arrows with different styles,
using wmlabs to draw the arrows, and
wmsetp to set attributes of the arrows.
 weather_sym_8.ncl:
This example illustrates drawing vectors with different attributes
using wmvect to draw the vectors,
wmsetp to set the attributes, and
wmvlbl to draw an informational label box.
weather_sym_8.ncl:
This example illustrates drawing vectors with different attributes
using wmvect to draw the vectors,
wmsetp to set the attributes, and
wmvlbl to draw an informational label box.
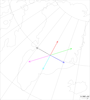
 weather_sym_9.ncl:
This example illustrates drawing vectors over a map
using wmvectmap to draw the vectors,
wmsetp to set the attributes, and
wmvlbl to draw an informational label box.
weather_sym_9.ncl:
This example illustrates drawing vectors over a map
using wmvectmap to draw the vectors,
wmsetp to set the attributes, and
wmvlbl to draw an informational label box.