NCL Home>
Application examples>
Models ||
Data files for some examples
 wrf_debug_1.ncl:
This example shows how to draw three different lat/lon grids
on a WRF output file: XLAT/XLONG, XLATU/XLONGU,
and XLATV/XLONGV.
wrf_debug_1.ncl:
This example shows how to draw three different lat/lon grids
on a WRF output file: XLAT/XLONG, XLATU/XLONGU,
and XLATV/XLONGV.
 wrf_debug_2.ncl:
This example shows a particular grid point on a
WRF XLAT/XLONG grid and its four corners. It shows
the same locations for the XLATU/XLONGU and
XLATV/XLONGV grids.
wrf_debug_2.ncl:
This example shows a particular grid point on a
WRF XLAT/XLONG grid and its four corners. It shows
the same locations for the XLATU/XLONGU and
XLATV/XLONGV grids.
 wrf_debug_3.ncl:
This example draws the grid locations
of XLAT/XLONG, XLATU/XLONGU, and XLATV/XLONGV
using markers and text indicating the index values.
wrf_debug_3.ncl:
This example draws the grid locations
of XLAT/XLONG, XLATU/XLONGU, and XLATV/XLONGV
using markers and text indicating the index values.
 wrf_debug_4.ncl:
This example shows the difference between using the
where function and the
wrf_user_ll_to_xy
function to subset a lat/lon grid.
wrf_debug_4.ncl:
This example shows the difference between using the
where function and the
wrf_user_ll_to_xy
function to subset a lat/lon grid.
Example pages containing:
tips |
resources |
functions/procedures
NCL Graphics: Debugging WRF grids
For a whole suite of examples using NCL to plot WRF-ARW data, we
recommend that you visit the WRF-ARW
Online Tutorial.
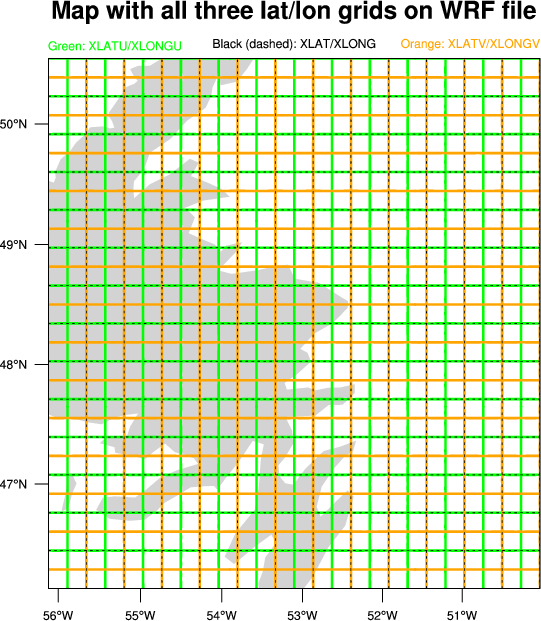 wrf_debug_1.ncl:
This example shows how to draw three different lat/lon grids
on a WRF output file: XLAT/XLONG, XLATU/XLONGU,
and XLATV/XLONGV.
wrf_debug_1.ncl:
This example shows how to draw three different lat/lon grids
on a WRF output file: XLAT/XLONG, XLATU/XLONGU,
and XLATV/XLONGV.
If you tried to draw all three sets of lat/lon lines on a full WRF map, the plot may be very busy, so this example also shows how to zoom in on a smaller area using wrf_user_ll_to_xy to get the index locations of a smaller corner defined by the soutwest and northeast corners.
wrf_debug_2.ncl:
This example shows a particular grid point on a
WRF XLAT/XLONG grid and its four corners. It shows
the same locations for the XLATU/XLONGU and
XLATV/XLONGV grids.
The purpose of this example is to help you understand how the various WRF grids are arranged.
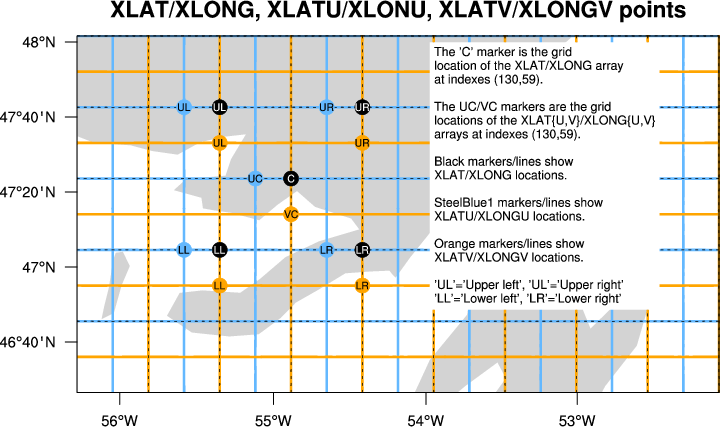
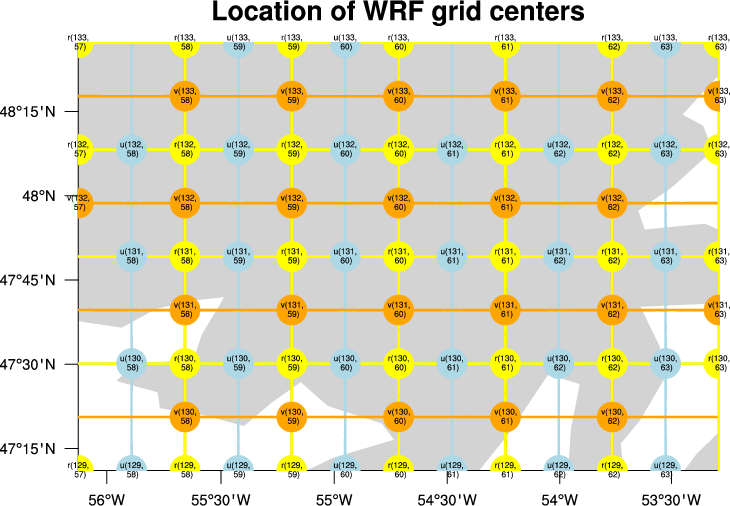 wrf_debug_3.ncl:
This example draws the grid locations
of XLAT/XLONG, XLATU/XLONGU, and XLATV/XLONGV
using markers and text indicating the index values.
wrf_debug_3.ncl:
This example draws the grid locations
of XLAT/XLONG, XLATU/XLONGU, and XLATV/XLONGV
using markers and text indicating the index values.
The purpose of this example is to help you understand how the various WRF grids are arranged.
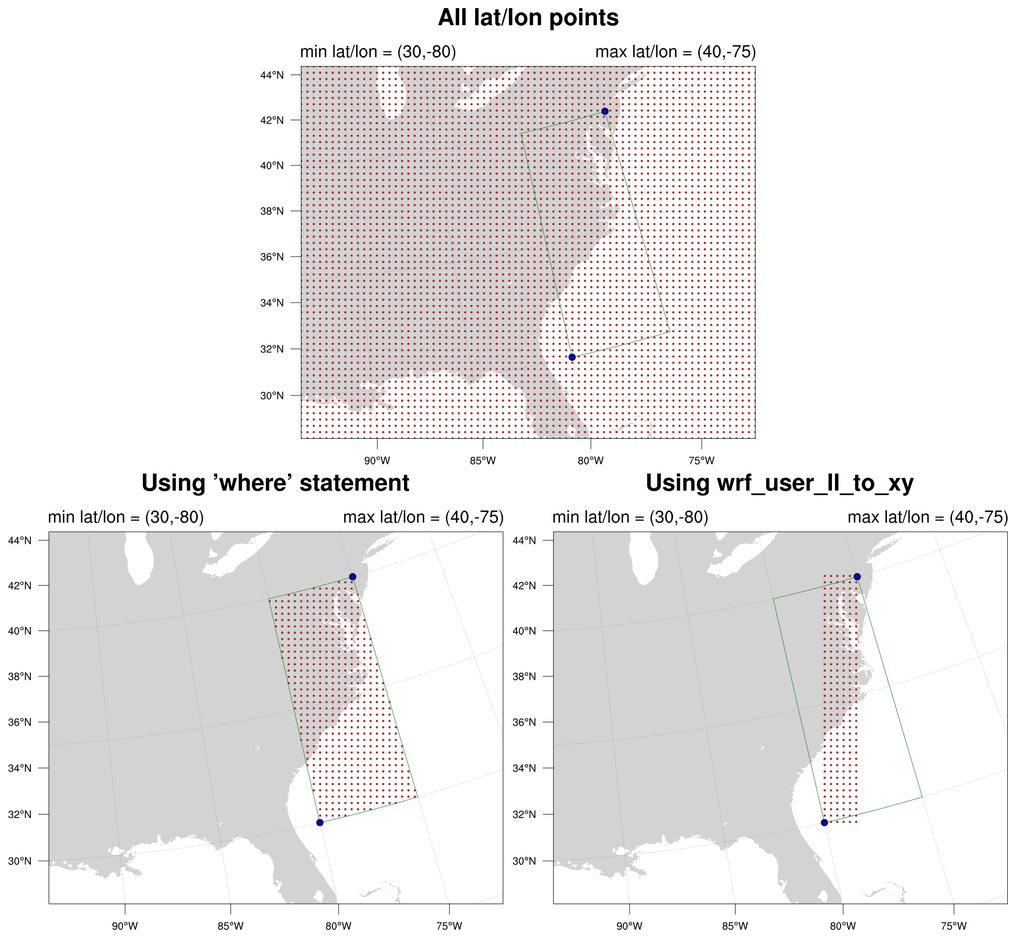 wrf_debug_4.ncl:
This example shows the difference between using the
where function and the
wrf_user_ll_to_xy
function to subset a lat/lon grid.
wrf_debug_4.ncl:
This example shows the difference between using the
where function and the
wrf_user_ll_to_xy
function to subset a lat/lon grid.
See wrf_gsn_10.ncl for an example of using these two methods plus a third method to subset data and then take a spatial average of the subsetted area.