gsn_contour_map
Creates and draws a contour plot over a map.
Prototype
load "$NCARG_ROOT/lib/ncarg/nclscripts/csm/gsn_code.ncl"  ; This library is automatically loaded
                                                          ; from NCL V6.2.0 onward.
                                                          ; No need for user to explicitly load.

	function gsn_contour_map (
		wks [1] : graphic,
		data    : numeric,
		res [1] : logical
	)

	return_val [1] :  graphic
Arguments
wksA Workstation identifier. The identifier is one returned either from calling gsn_open_wks or calling create to create a Workstation object.
dataThe data to contour; must be one- or two-dimensional.
resA variable containing an optional list of plot resources, attached as attributes. Set to True if you want the attached attributes to be applied, and False if you either don't have any resources to set, or you don't want the resources applied.
Return value
A scalar id of the map created is returned. The id of the contour plot is returned as an attribute called contour, and the id of the data is returned as an attribute called data. This is useful if you want to use setvalues to change some data or contour options after this function has been called.
Description
This function creates and draws a contour plot over a map on the given workstation.
If data is two-dimensional, then the leftmost dimension is represented on the Y (latitude) axis, and the rightmost dimension on the X (longitude) axis.
If data is one-dimensional, then res@sfXArray and res@sfYArray must also be set to one-dimensional arrays of the same length, and a triangulation algorithm will be used to generate the contours.
If data has a _FillValue attribute, this value will be used as a missing value. If data has a long_name attribute, this value will be used as the main title.
You should use gsn_csm_contour_map if you want a more customized contour plot and/or if your data has coordinate arrays.
To maximize the area that the plot is drawn in, set the special resource gsnMaximize to True.
See Also
gsn_contour
Special gsn resources
Examples
For some application examples, see:
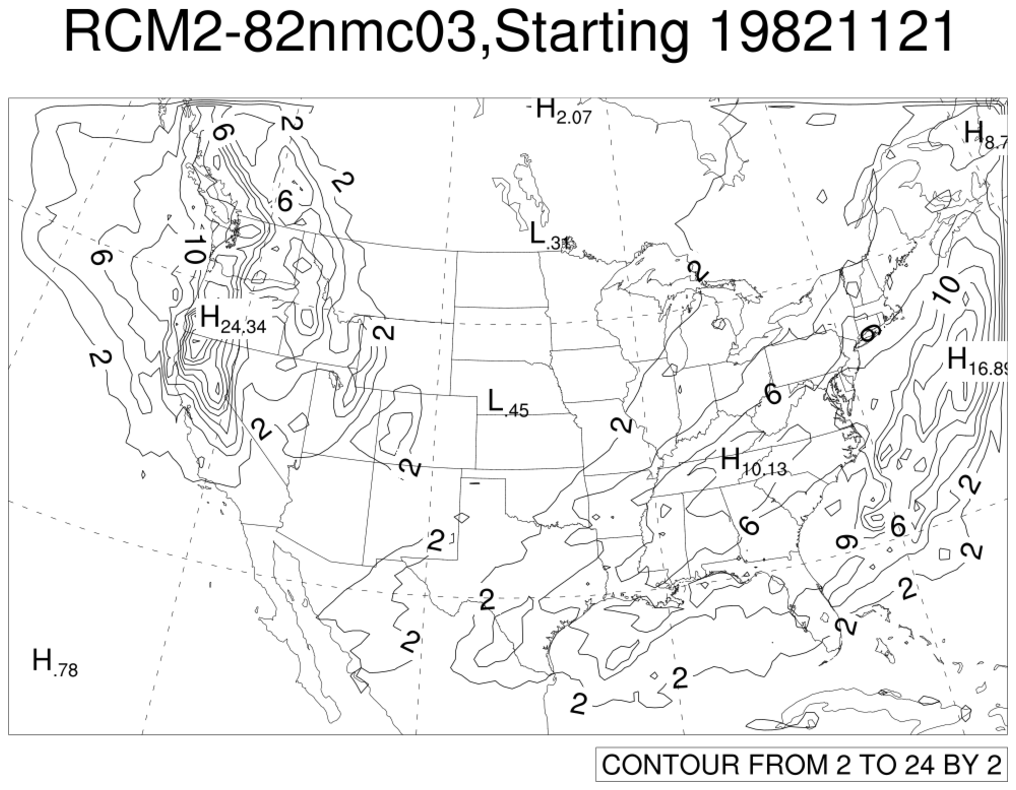
- "rcm_4.ncl" (view example)
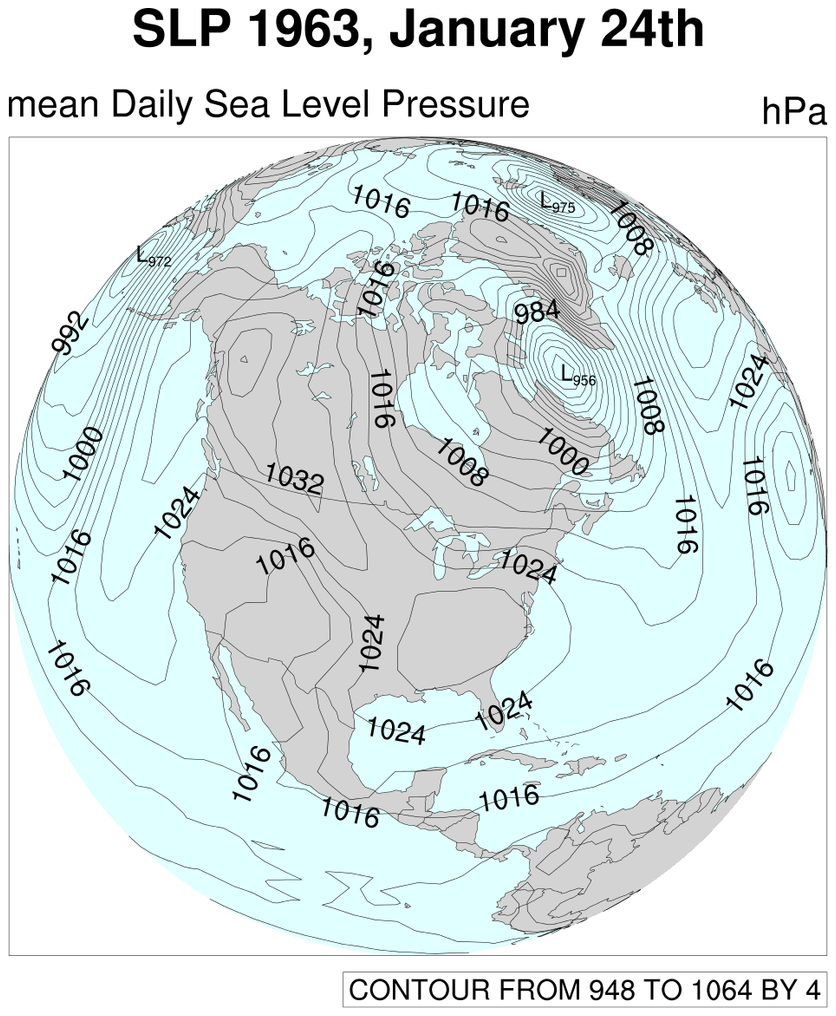
- "sat_1.ncl" (view example)
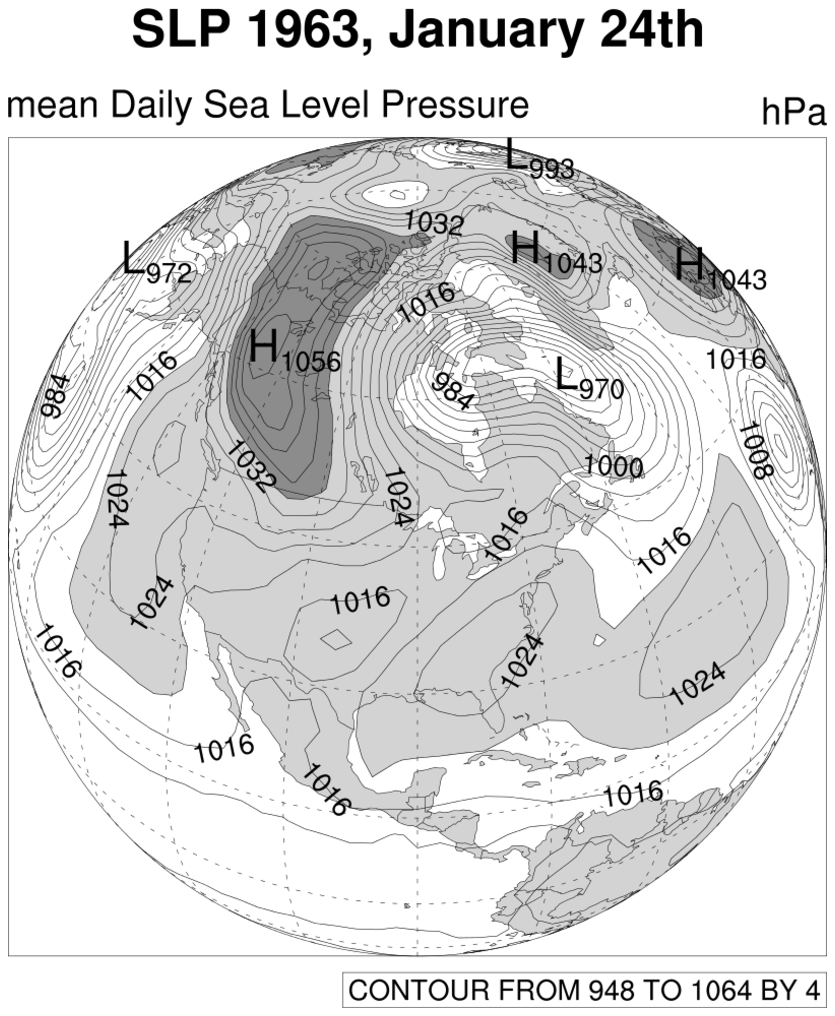
- "sat_2.ncl" (view example)