gsn_csm_attach_zonal_means
Attaches a zonal means plot to a contour/map plot.
Prototype
load "$NCARG_ROOT/lib/ncarg/nclscripts/csm/gsn_code.ncl"  ; These two libraries are automatically
load "$NCARG_ROOT/lib/ncarg/nclscripts/csm/gsn_csm.ncl"   ; loaded from NCL V6.2.0 onward.
                                                          ; No need for user to explicitly load.

	function gsn_csm_attach_zonal_means (
		wks [1] : graphic,
		map [1] : graphic,
		data    : numeric,
		res [1] : logical
	)

	return_val [1] :  graphic
Arguments
wksA Workstation identifier. The identifier is one returned either from calling gsn_open_wks or calling create to create a Workstation object.
mapThe identifier returned from calling one of the map plot functions, like gsn_csm_contour_map.
dataThe data to use for calculating the zonal means. This will likely be the data that was used to generate contours overlaid on a map.
resA variable containing an optional list of plot resources, attached as attributes. Set to True if you want the attached attributes to be applied, and False if you either don't have any resources to set, or you don't want the resources applied.
Return value
A scalar id of the XY/zonal plot created is returned.
Description
This function creates and attaches a zonal means plot to the right edge of a given map plot. Most likely, it will be used to attach a zonal means plot to a plot of contours overlaid on a map. This function produces the same results as setting gsnZonalMean to True when calling gsn_csm_contour_map or gsn_csm_contour_map_ce. It should only be used if you need more control over the zonal means plot, or if you are not using one of those two functions.
By default, this function does not draw the plot or advance the frame. Set the resources gsnDraw and/or gsnFrame to True if you need this.
The special resources gsnZonalMeanXMaxF and gsnZonalMeanXMinF allow the user to change the X-axis of the zonal average plot. gsnZonalMeanYRefLine sets the value that the reference line will be drawn at on the zonal average plot (default value = 0).
To maximize the area that the plot is drawn in, set the special resource gsnMaximize to True.
To change which edge to attach the zonal means plot, you can set amSide (the default is "left"). To move the zonal plot away from or closer to the map plot, use amOrthogonalPosF.
See Also
Examples
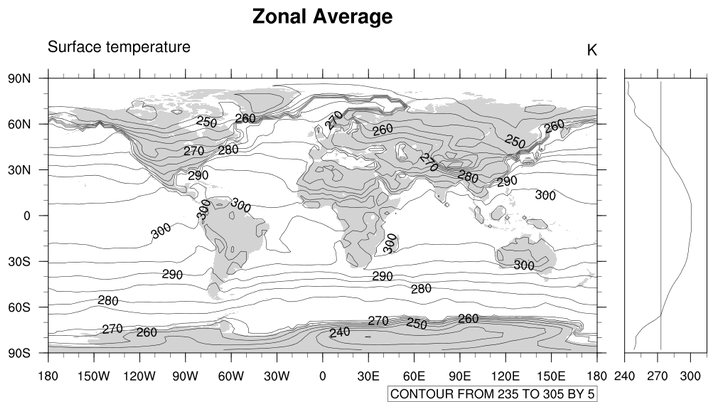
For an example of what a zonal means plot looks like, see:
- "zonal_3.ncl"
(view
example)
This plot was generated using the gsnZonalMean resource.
Here's an example of creating a zonal means plot without using gsnZonalMean:
load "$NCARG_ROOT/lib/ncarg/nclscripts/csm/gsn_code.ncl"
load "$NCARG_ROOT/lib/ncarg/nclscripts/csm/gsn_csm.ncl"

begin
;
; variable and file handling
;
  in  = addfile("83.nc","r")
  ts = in->TS(0,:,:)                            ; select variable to ave
;
; plotting
;
  wks  = gsn_open_wks("x11","zonal")            ; Opens a ps file

  res                 = True		        ; make plot mods
  res@tiMainString    = "Zonal Average"         ; Title for the plot

  zres@vpWidthF             = 0.13    ; Make plot less wide than default.
  zres@amOrthogonalPosF     = 0.09    ; Move zonal plot away from map a little.

  res@gsnFrame             = False              ; don't draw yet
  res@gsnDraw              = False              ; don't advance frame

  plot = gsn_csm_contour_map_ce(wks,ts,res)     ; plot temp contours

  zres                      = True

  zres@gsnDraw              = True
  zres@gsnFrame             = True

  zres@gsnZonalMeanXMinF    = 240      ; min X-axis value for zonal mean plot
  zres@gsnZonalMeanXMaxF    = 315      ; max X-axis value for zonal mean plot
  zres@gsnZonalMeanYRefLine = 273.15   ; X-axis reference line value

  zonal_id = gsn_csm_attach_zonal_means(wks,plot,ts,zres)
end