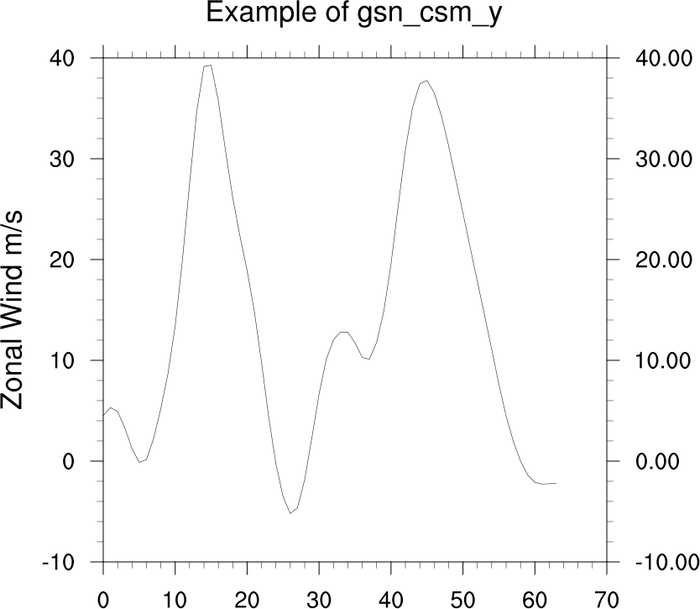
gsn_csm_y
Creates and draws an XY plot, using index values for the X axis.
Prototype
load "$NCARG_ROOT/lib/ncarg/nclscripts/csm/gsn_code.ncl"  ; These two libraries are automatically
load "$NCARG_ROOT/lib/ncarg/nclscripts/csm/gsn_csm.ncl"   ; loaded from NCL V6.2.0 onward.
                                                          ; No need for user to explicitly load.

	function gsn_csm_y (
		wks [1] : graphic,
		y       : numeric,
		res [1] : logical
	)

	return_val [1] :  graphic
Arguments
wksA Workstation identifier. The identifier is one returned either from calling gsn_open_wks or calling create to create a Workstation object.
yThe Y coordinates of the curve(s). If y is two-dimensional, then the leftmost dimension determines the number of curves.
resA variable containing an optional list of plot resources, attached as attributes. Set to True if you want the attached attributes to be applied, and False if you either don't have any resources to set, or you don't want the resources applied.
Return value
A scalar id of the XY plot created is returned. The id of the data object is also returned as an attribute called data. This is useful if you want to use setvalues to change some data options after this function has been called.
Description
This function creates and draws an XY plot on the given workstation, using index values for the X axis. By default, the tickmarks will point outward.
If y has a _FillValue attribute, this value will be used as a missing value. If y has a "long_name" and/or "units" attribute, these will be used to label the Y axis, unless the tickmarks on the Y axis are explicitly labeled using the tmYLMode resource.
If gsnYRefLine is set to some value, then a reference line will be drawn at that value.
If gsnAboveYRefLineColor and/or gsnBelowYRefLineColor are set, then the areas between the Y reference line and the Y-curve are filled in the appropriate color.
There are other special GSN resources that apply to XY plots. See the gsn resource page for a full list.
To maximize the area that the plot is drawn in, set the special resource gsnMaximize to True.
See Also
gsn_csm_xy,
gsn_csm_xy2,
gsn_csm_x2y,
gsn_csm_x2y2,
gsn_xy,
gsn_y
Special gsn resources
Examples
For some application examples, see:
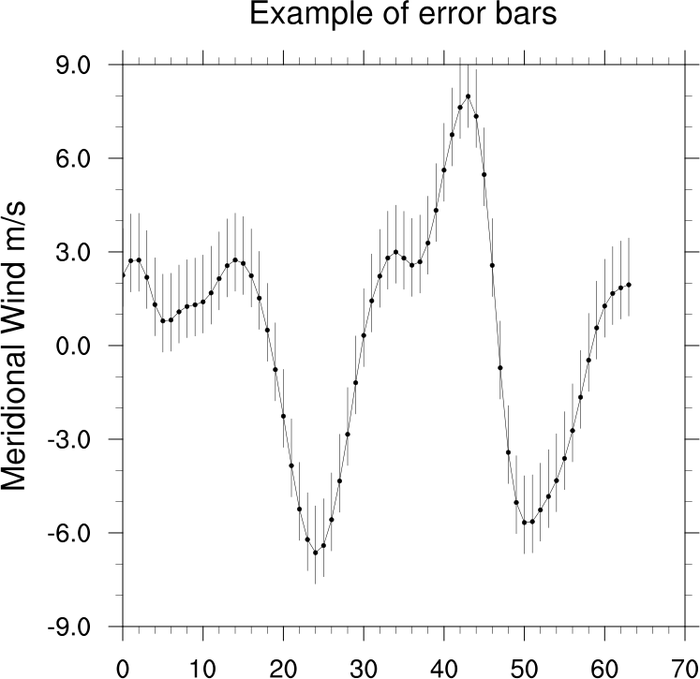
- "xy_11.ncl" (view example)
- "xy_13.ncl" (view example)