NCL > Application examples > Basic examples
VectorPlot examples
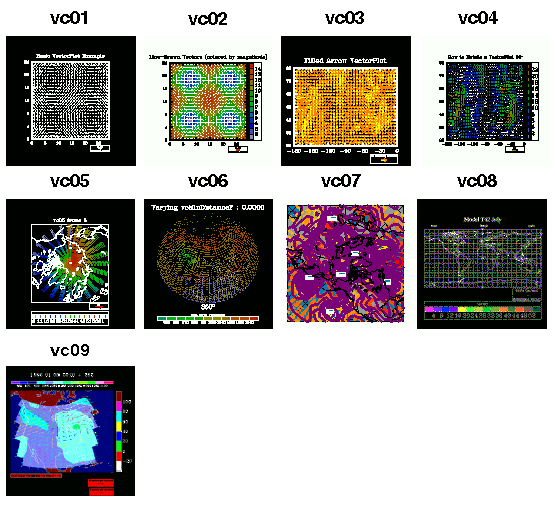
This module is a graphical index to the HLU and NCL NCAR Graphics examples that generate vector plots. Click on one of the example graphics below to link to information about how to create the graphic and how to access the code and data that were used to generate the plot.

- vc01: How to create a VectorPlot using
default settings.
- vc02: How to create line-drawn
vector arrows and use some basic VectorPlot resources.
- vc03: How to manipulate the FillArrow
resources to demonstrate some of the possible stylistic variations on
the appearance of filled vector arrows.
- vc04: How to rotate a VectorPlot 90
degrees while preserving the original relationship of the data
elements.
- vc05: How to overlay a VectorPlot on a
MapPlot.
- vc06: How to use a scalar field to determine
the color of the vector arrow fill.
- vc07: How to overlay contours and vectors on
a MapPlot.
- vc08: How to plot vectors and color them by wind speed.
- vc09: How to do a vector animation using vectors and color contours of wind, temperature, and pressure