NCL Home> Application examples> generic graphical interfaces || Data files for some examples

Example pages containing: tips | resources | functions/procedures

NCL Graphics: Contours (generic high-level plot interface)

Contour Type Plot Templates
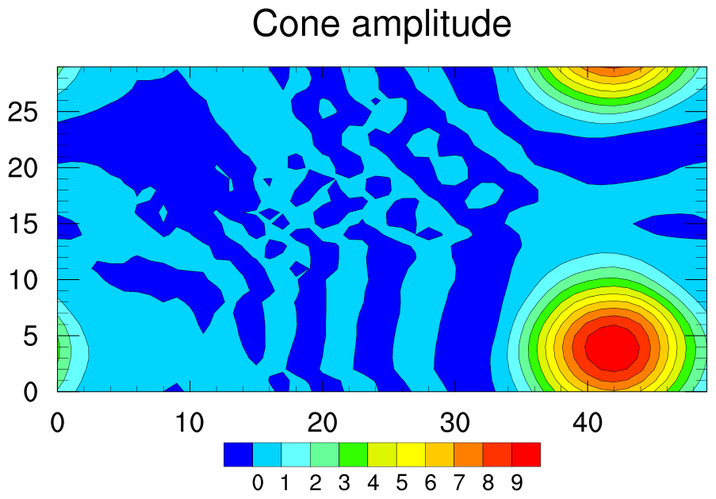
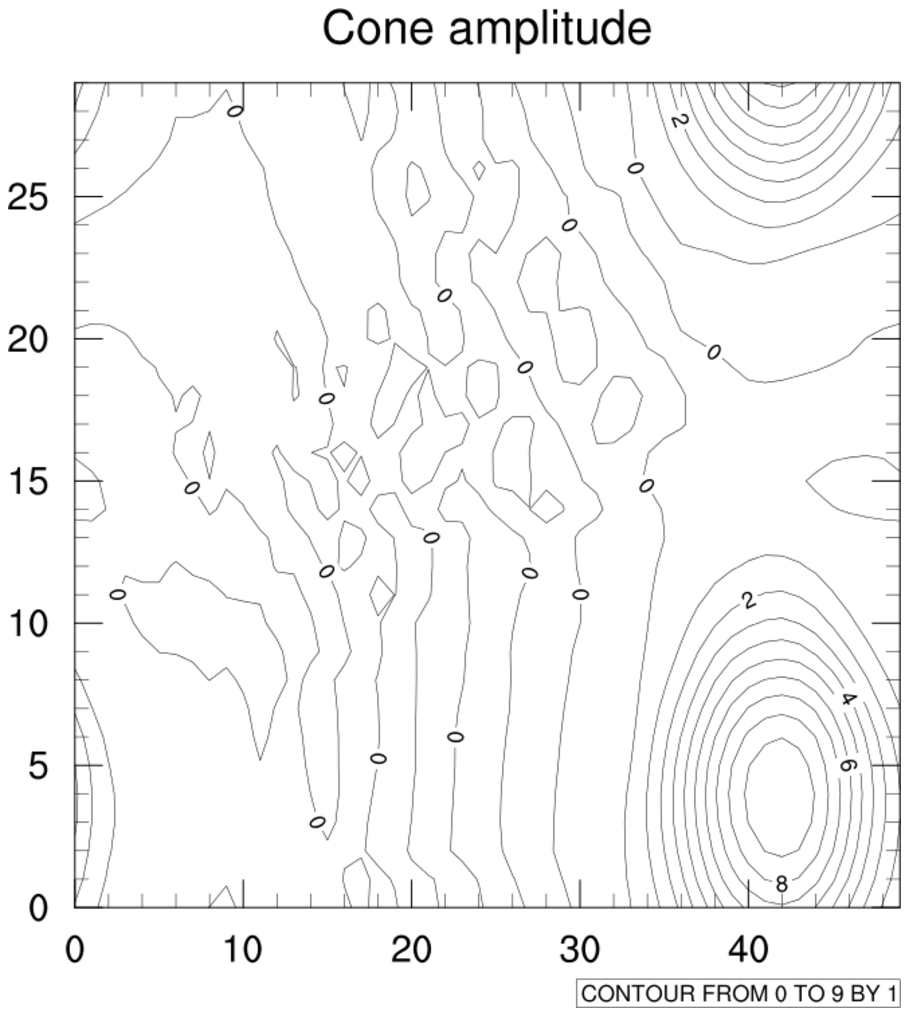
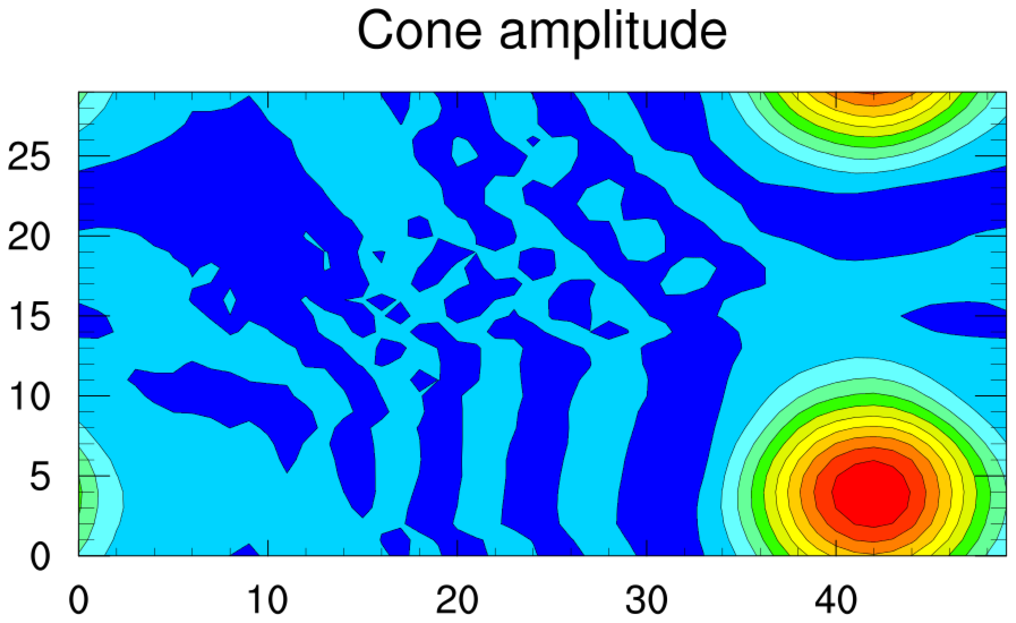
gsn_contour

This function creates very generic contour plots.

We recommend that you use the more customized functions:

gsn_csm_contour
gsn_csm_contour_map

for creating contour plots.

See the "contours without maps" and "contours over map" examples pages for more customized contour plots.

gsn_contour_1.ncl: Default plot

gsn_contour_2.ncl: Adds color, and changes the aspect ratio.

cnFillOn = True, Turns on color
cnLineLabelsOn = False, Turns off the contour line labels
cnInfoLabelOn = False, Turns off the contour informationlabel.

The following four resources change the aspect ratio of the plot:
vpWidthF = 0.8
vpHeightF = 0.4
vpXF = .1
vpYF = .7

tmXBLabelFontHeightF = 0.025 and tmYLLabelFontHeightF = 0.025, Adjust the font height of the tickmark labels. When we change the aspect ratio, the font size gets distorted as well.

gsn_contour_3.ncl: Adds a label bar.

pmLabelBarDisplayMode = "Always", turns on label bar.
pmLabelBarSide = "Bottom",puts it on the bottom of plot
pmLabelBarWidthF = 0.4, controls the size of label bar
pmLabelBarHeightF = 0.1
pmLabelBarOrthogonalPosF = -0.02, positions the label bar wrt the perpendicular axis of the plot.
lbLabelFontHeightF = .010, label font size
lbLabelStride = 2, skip every other label
lbOrientation = "Horizontal", orientation
lbPerimOn = False, turn off label bar perimeter box
lbAutoManage = False, don't let plot manager control label bar