NCL Home>
Application examples>
gsn_csm graphical interfaces ||
Data files for some examples
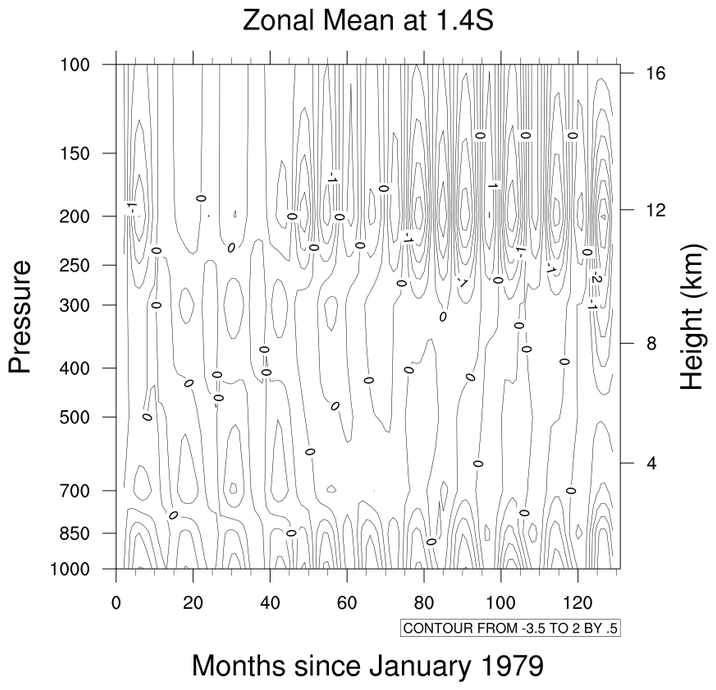
 h_time_1.ncl:
Default black and white time vs. height plot
h_time_1.ncl:
Default black and white time vs. height plot
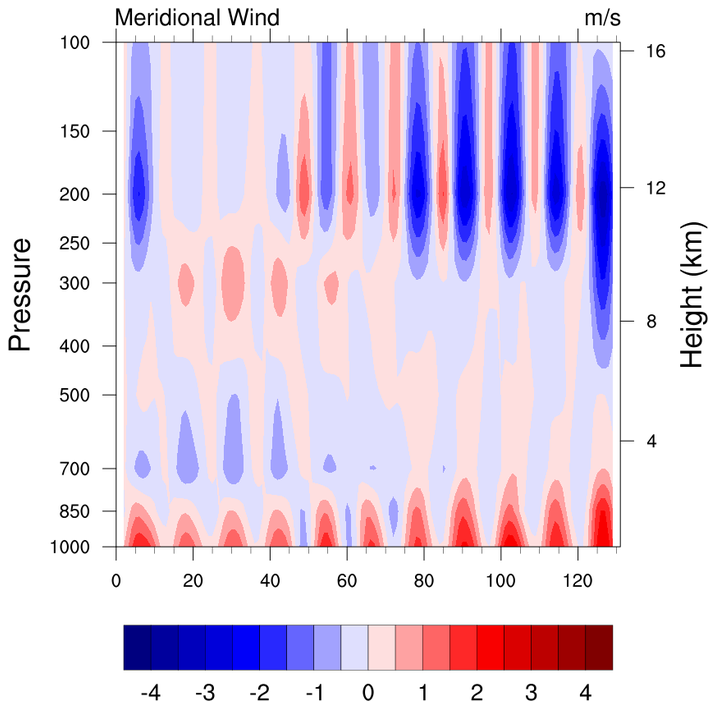
 h_time_2.ncl: Shades values less
than -0.5 and greater than +0.5
h_time_2.ncl: Shades values less
than -0.5 and greater than +0.5
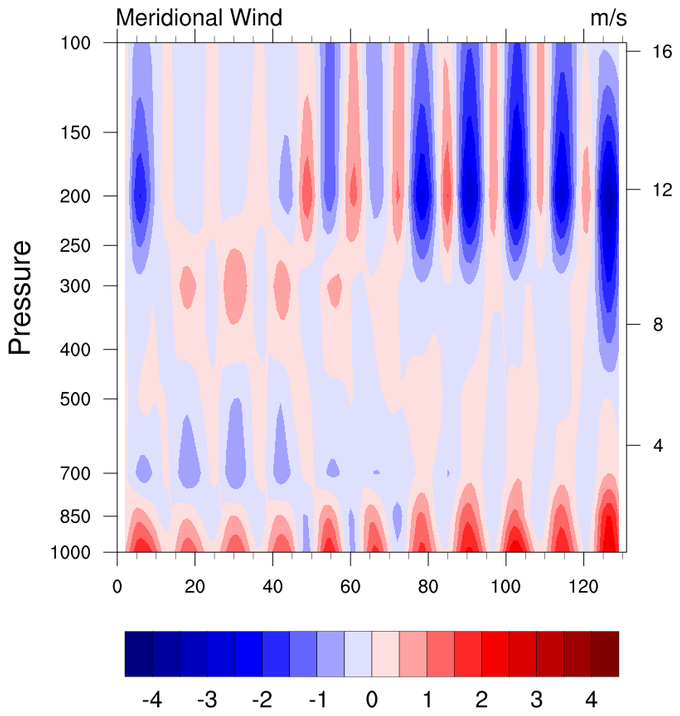
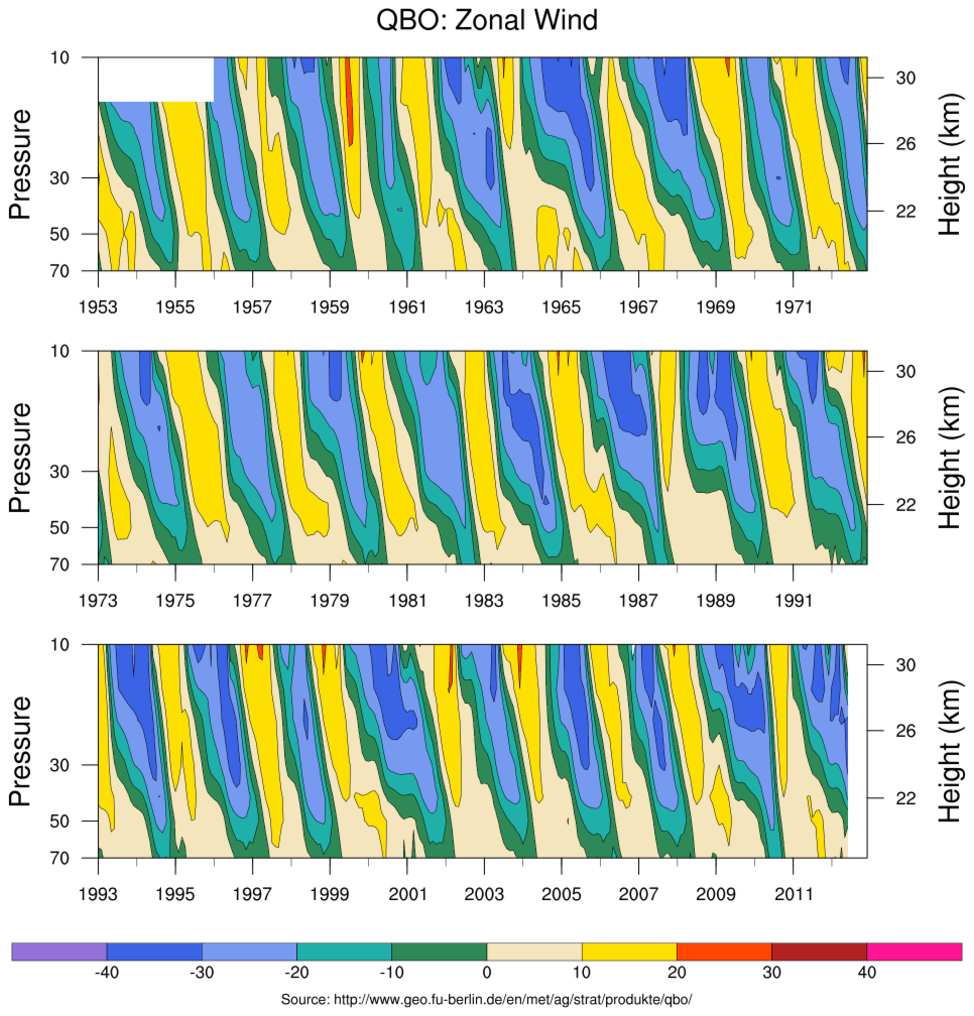
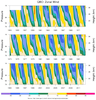 h_time_6.ncl: Plot of the
Quasi Biennial Oscillation [QBO]. The paneled figure is a result of using
20 year periods for readability. For 'fun', a different color table
is used.
h_time_6.ncl: Plot of the
Quasi Biennial Oscillation [QBO]. The paneled figure is a result of using
20 year periods for readability. For 'fun', a different color table
is used.
Example pages containing:
tips |
resources |
functions/procedures
NCL Graphics: Pressure/Height vs. Time (high-level plot interface)
Data must be in pressure coordinates!
 h_time_1.ncl:
Default black and white time vs. height plot
h_time_1.ncl:
Default black and white time vs. height plot
gsn_csm_pres_hgt is the plot interface that creates time vs. height plots.
Note, the data must be on pressure levels to use this interface.
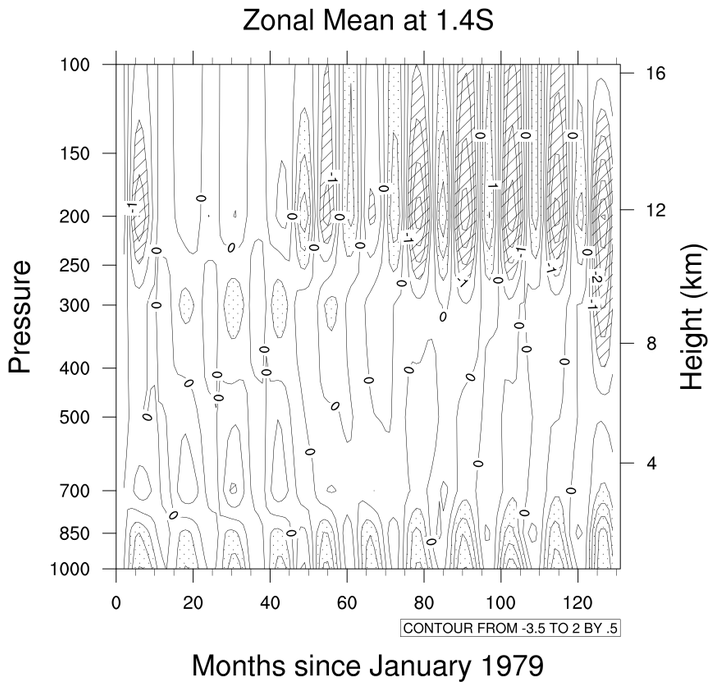 h_time_2.ncl: Shades values less
than -0.5 and greater than +0.5
h_time_2.ncl: Shades values less
than -0.5 and greater than +0.5
ShadeLtGtContour is the function that does the shading.
There are numerous contour effects to choose from.
h_time_4.ncl: Demonstrates how to
adjust the number of height levels displayed on the right axis.
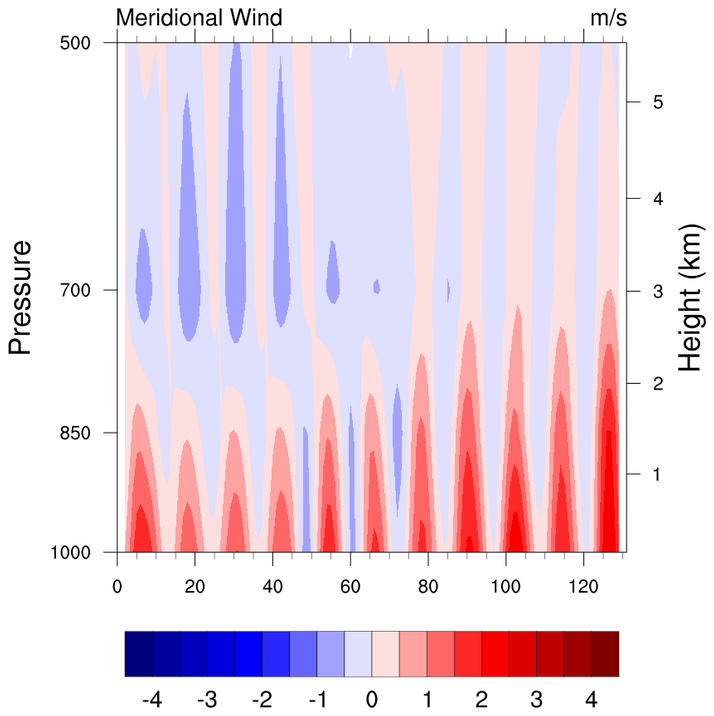 tmYRTickSpacingF controls the
spacing of the height labels.
tmYRTickSpacingF controls the
spacing of the height labels.
 h_time_6.ncl: Plot of the
Quasi Biennial Oscillation [QBO]. The paneled figure is a result of using
20 year periods for readability. For 'fun', a different color table
is used.
h_time_6.ncl: Plot of the
Quasi Biennial Oscillation [QBO]. The paneled figure is a result of using
20 year periods for readability. For 'fun', a different color table
is used.