NCL Home >
Documentation >
Functions >
Graphics routines
msgValOutline
Draws an outline around missing data in vector and streamline plots.
Prototype
load "$NCARG_ROOT/lib/ncarg/nclscripts/csm/gsn_code.ncl"      ; These four libraries are automatically
load "$NCARG_ROOT/lib/ncarg/nclscripts/csm/gsn_csm.ncl"       ; loaded from NCL V6.4.0 onward.
load "$NCARG_ROOT/lib/ncarg/nclscripts/csm/contributed.ncl"   ; No need for user to explicitly load.
load "$NCARG_ROOT/lib/ncarg/nclscripts/csm/shea_util.ncl"

	function msgValOutline (
		wks      : graphic,
		plot     : graphic,
		x [*][*] : numeric
	)

	return_val [1] :  graphic
Arguments
wksA Workstation identifier. The identifier is one returned either from calling gsn_open_wks or calling create to create a Workstation object.
plotThe plot to be modified.
xAn array dimensioned lat x lon, which matches the array passed to the vector plotting function.
Return value
The modified plot is returned.
Description
This procedure returns plot with the missing data outlined in light gray. If there is no light gray in your colormap, then the next closest color will be used.
The missing values (x@_FillValue) of x are used to draw the outline.
You need to draw the plot and advance the frame after calling this function.
Examples
Example 1
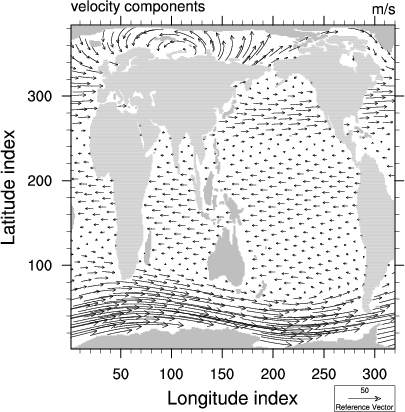
load "$NCARG_ROOT/lib/ncarg/nclscripts/csm/gsn_code.ncl"
load "$NCARG_ROOT/lib/ncarg/nclscripts/csm/gsn_csm.ncl"
load "$NCARG_ROOT/lib/ncarg/nclscripts/csm/contributed.ncl"
load "$NCARG_ROOT/lib/ncarg/nclscripts/csm/shea_util.ncl"

begin
  f      = addfile ("/cgd/cas/shea/MURPHYS/ATMOS/80.nc", "r")
  uwnd      = f->u(0,17,:,:)
  vwnd      = f->v(0,17,:,:)
  uwnd@_FillValue = 1.e+20
  vwnd@_FillValue = 1.e+20
  uwnd({40.:60.},{140.:190.}) = uwnd@_FillValue     ;set an area to missing for demonstration purposes

  wks = gsn_open_wks("ps","test")
  res                     = True
  res@gsnDraw = False
  res@gsnFrame = False
  plot = gsn_csm_vector_map_ce(wks,uwnd(::2,::2),vwnd(::2,::2),res)   ;plot every other vector
  plot = msgValOutline(wks,plot,w,uwnd(::2,::2))
  draw(plot)
  frame(wks)
end
For an application example, see: