gsn_csm_map_polar
Creates and draws a polar stereographic map.
Prototype
load "$NCARG_ROOT/lib/ncarg/nclscripts/csm/gsn_code.ncl"  ; These two libraries are automatically
load "$NCARG_ROOT/lib/ncarg/nclscripts/csm/gsn_csm.ncl"   ; loaded from NCL V6.2.0 onward.
                                                          ; No need for user to explicitly load.

	function gsn_csm_map_polar (
		wks [1] : graphic,
		res [1] : logical
	)

	return_val [1] :  graphic
Arguments
wksA Workstation identifier. The identifier is one returned either from calling gsn_open_wks or calling create to create a Workstation object.
resA variable containing an optional list of plot resources, attached as attributes. Set to True if you want the attached attributes to be applied, and False if you either don't have any resources to set, or you don't want the resources applied.
Return value
A scalar id of the map plot created is returned. This is useful if you want to use setvalues to change some plot options after this function has been called.
Description
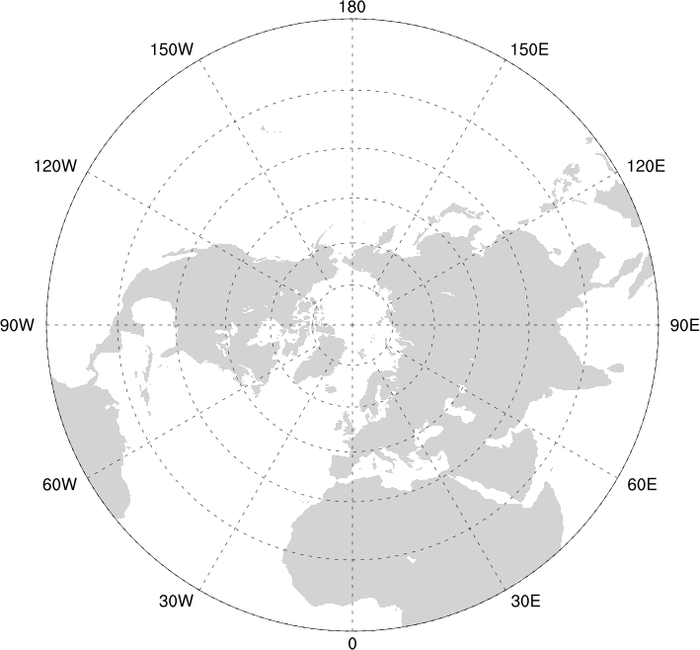
This function creates and draws a polar stereographic map plot on the given workstation. The default is to show only the northern hemisphere, unless the special resource gsnPolar is set to "SH".
Important note: in NCL version 6.4.0, the mpDataBaseVersion resource was updated from having a default of "LowRes" to having a default value of "Dynamic". The "LowRes" database will still be the default, unless either of the boundary-set resources mpFillBoundarySets or mpOutlineBoundarySets are set to anything other than "Geophysical", in which case the "MediumRes" database will be used. See the map outlines page for example scripts.
This function puts special longitude labels around the polar map. These labels can be controlled only through a limited set of gsnPolar* resources. To turn off the labels completely, set the resource gsnTickMarksOn to False.
For the map, the following will happen automatically:
- the continents will be colored gray
- the continental outlines will be turned off
- the longitude locations will be labeled
To maximize the area that the plot is drawn in, set the special resource gsnMaximize to True.
See Also
gsn_map,
gsn_csm_map,
gsn_csm_map_ce
Special gsn resources
Examples
For some application examples, see: