gsn_map
Creates and draws a map.
Prototype
load "$NCARG_ROOT/lib/ncarg/nclscripts/csm/gsn_code.ncl"  ; This library is automatically loaded
                                                          ; from NCL V6.2.0 onward.
                                                          ; No need for user to explicitly load.

	function gsn_map (
		wks        [1] : graphic,
		projection [1] : string,
		res        [1] : logical
	)

	return_val [1] :  graphic
Arguments
wksA Workstation identifier. The identifier is one returned either from calling gsn_open_wks or calling create to create a Workstation object.
projectionThe map projection to use.
resA variable containing an optional list of plot resources, attached as attributes. Set to True if you want the attached attributes to be applied, and False if you either don't have any resources to set, or you don't want the resources applied.
Return value
A scalar id of the map plot created is returned. This is useful if you want to use setvalues to change some plot options after this function has been called.
Description
This function creates and draws a map plot on the given workstation. For a valid list of map projections, see the projections associated with the mpProjection resource.
Important note: in NCL version 6.4.0, the mpDataBaseVersion resource was updated from having a default of "LowRes" to having a default value of "Dynamic". The "LowRes" database will still be the default, unless either of the boundary-set resources mpFillBoundarySets or mpOutlineBoundarySets are set to anything other than "Geophysical", in which case the "MediumRes" database will be used. See the map outlines page for example scripts.
You should use gsn_csm_map if you want a more customized contour plot and/or if your data has coordinate arrays.
Here's comparison between using a "gsn_csm" mapping function, and a generic "gsn" function (click on either thumbnail for a larger view):
| gsn_csm | gsn generic |
|---|---|
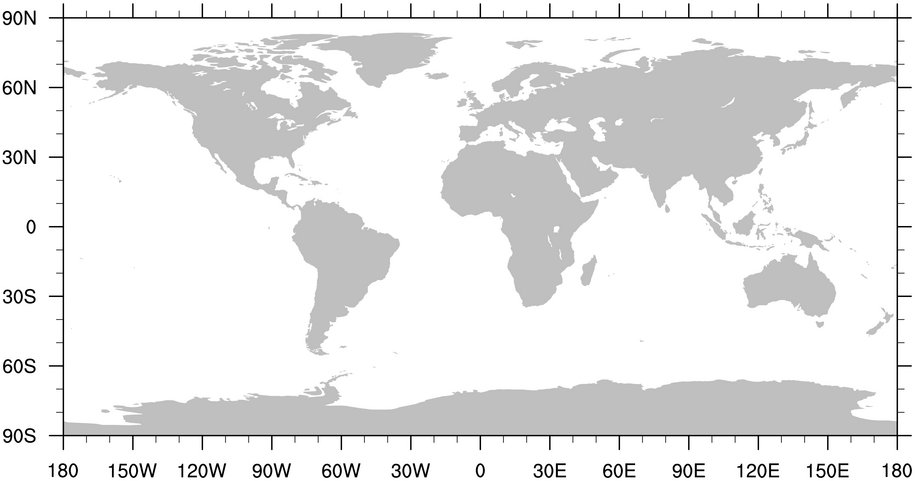
|
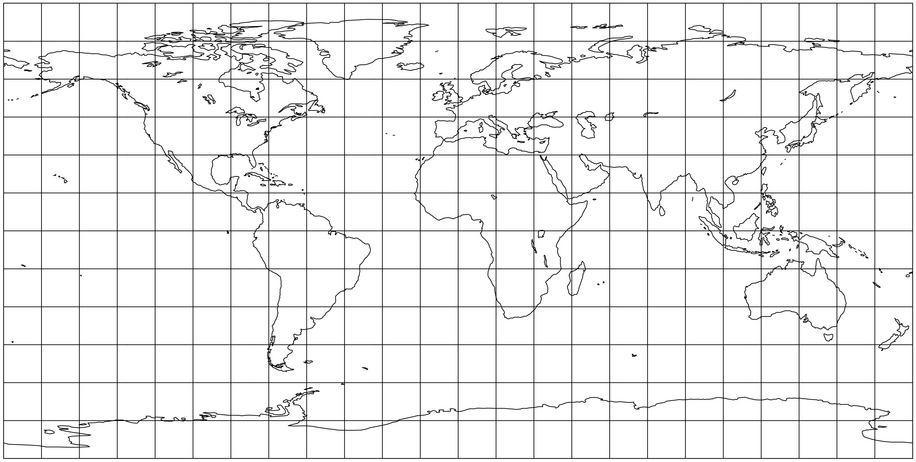
|
To maximize the area that the plot is drawn in, set the special resource gsnMaximize to True.
See Also
gsn_csm_map,
gsn_csm_map_ce,
gsn_csm_map_polar
Special gsn resources
Examples
For some application examples, see: