NCL > Application examples > Basic examples
MapPlot examples
This module is a graphical index to the HLU and NCL NCAR Graphics examples that generate map plots. Click on one of the example graphics below to link to information about how to create the graphic and how to access the code and data that were used to generate the plot.
| mp01 | mp02 | mp03 | mp04 |
|---|---|---|---|
| 
| 
| 
|
| mp05 | mp06 | mp07 | |
| 
| 
|
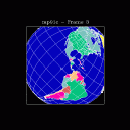
- mp01: How to use basic MapPlot capabilities.
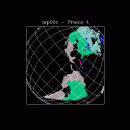
- mp02: How to control individual map areas.
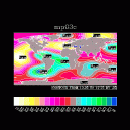
- mp03: How to use masking and overlays with maps.
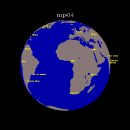
- mp04: How to add textual annotations to a map.
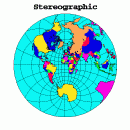
- mp05: How to draw the ten different map projections.
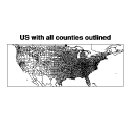
- mp06: How to draw county lines in the mainland US.
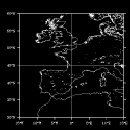
- mp07: How to draw high-resolution coastlines using the RANGS/GSHHS database.