Line Type Plot Templates
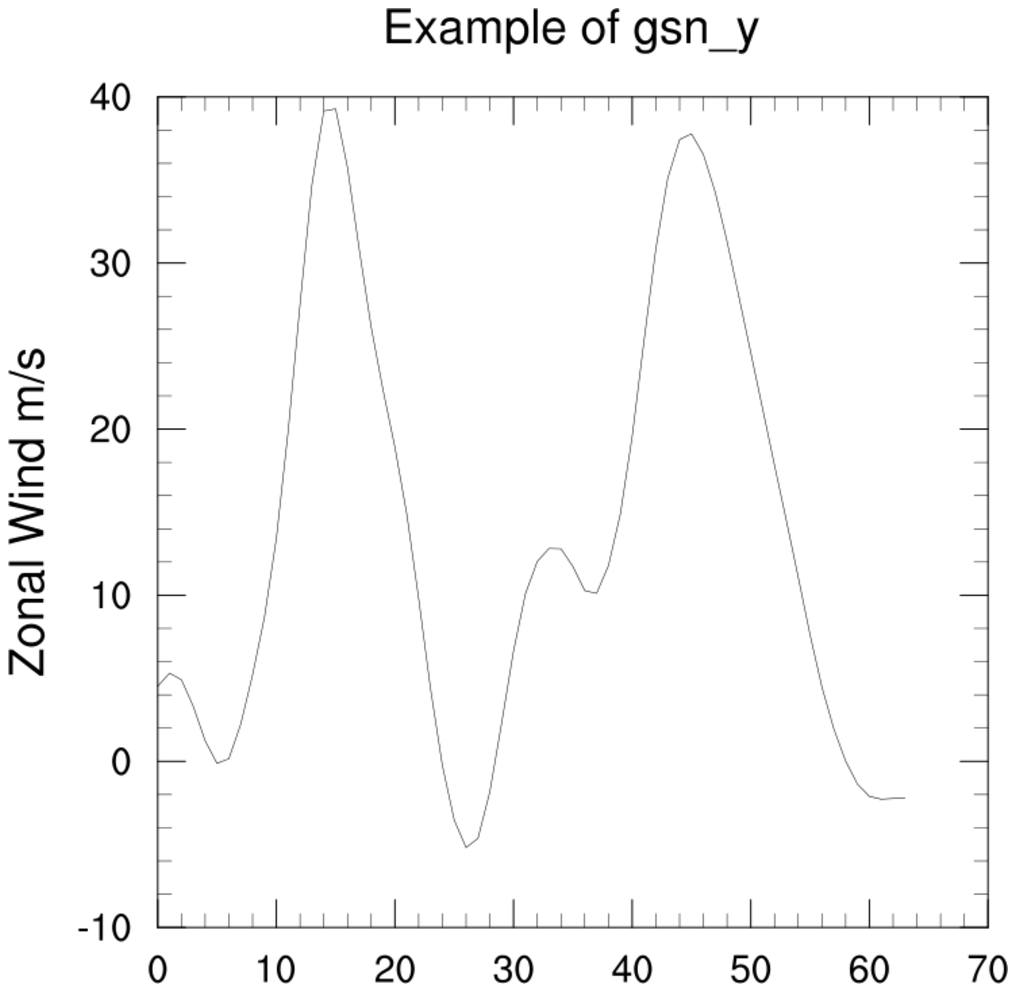
gsn_xygsn_y
These functions create generic XY plots.
We recommend that you use the more customized functions:
See the "XY plotting page" examples page for more customized XY plots.
Example pages containing:
tips |
resources |
functions/procedures
These functions create generic XY plots.
We recommend that you use the more customized functions:
See the "XY plotting page" examples page for more customized XY plots.
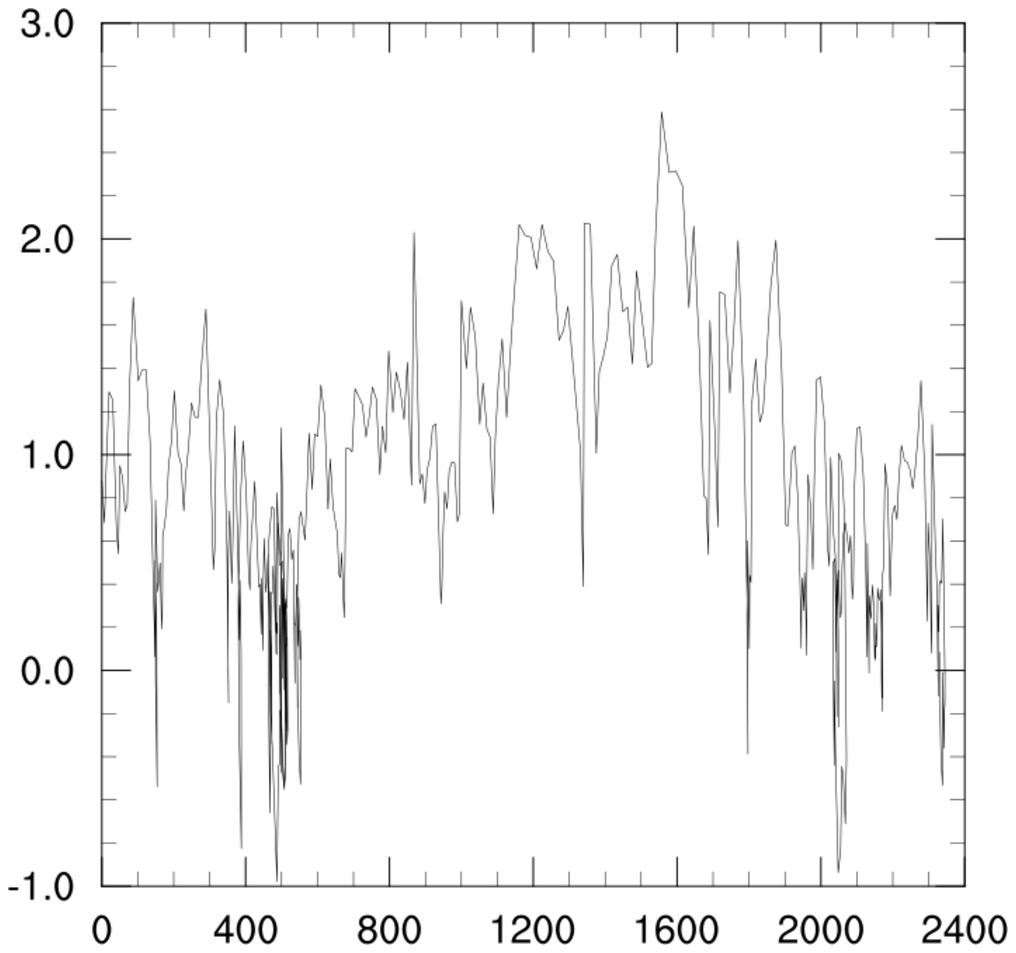 gsn_xy_1.ncl:
Default plot from ACSII data. The "data.asc" data file, which is
no longer available, had 6 columns of data and 500 rows of data.
gsn_xy_1.ncl:
Default plot from ACSII data. The "data.asc" data file, which is
no longer available, had 6 columns of data and 500 rows of data.
gsn_xy is the generic plot interface that creates xy plots.
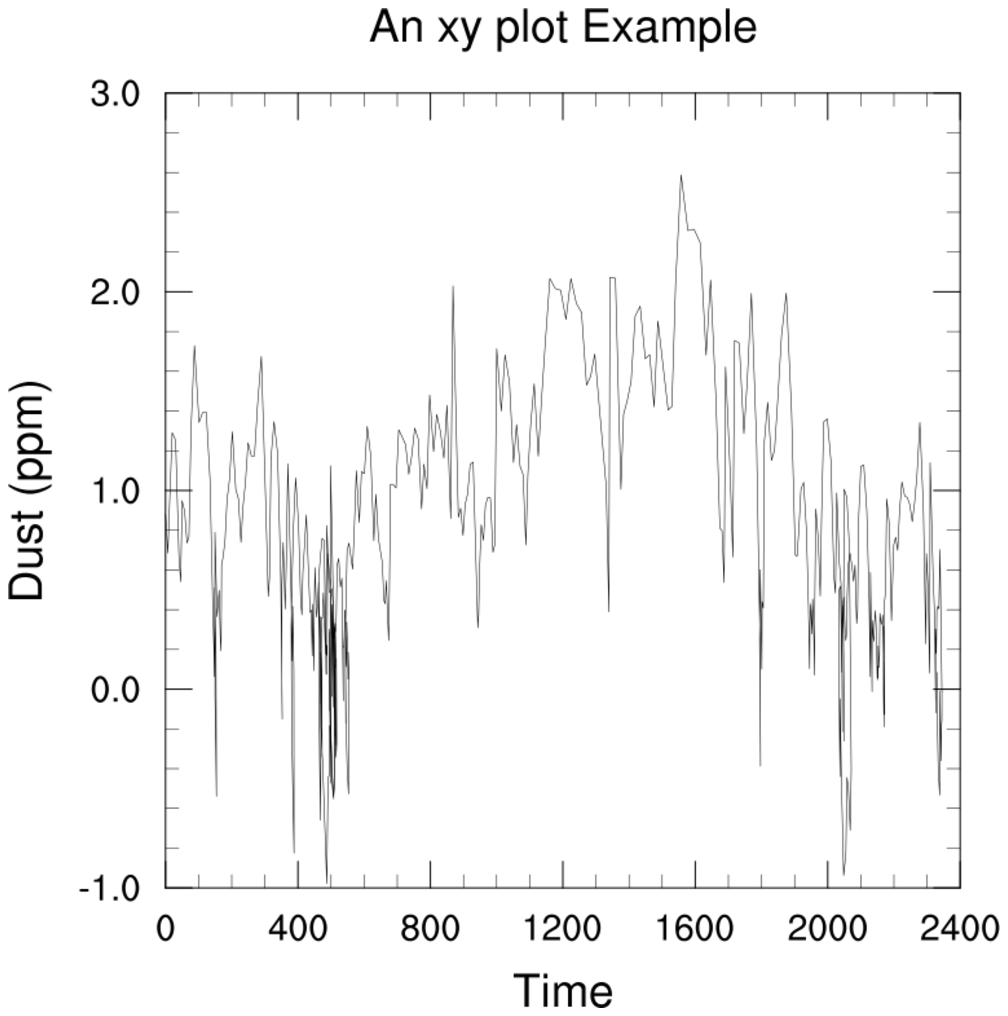 gsn_xy_2.ncl:
Add some titles.
gsn_xy_2.ncl:
Add some titles.
tiMainString = "An xy plot
Example", Adds a plot title
tiYAxisString = "Dust (ppm)", Adds
a y-axis title
tiXAxisString = "Time", Adds an
x-axis title.
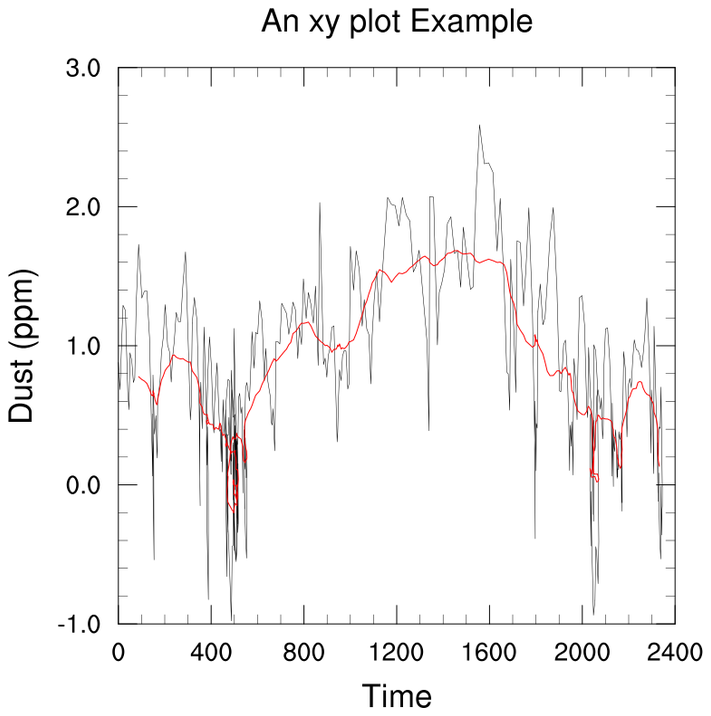
 gsn_xy_3.ncl:
Demonstrates multiple lines, line color, thickness, and pattern.
gsn_xy_3.ncl:
Demonstrates multiple lines, line color, thickness, and pattern.
xyLineColors = (/"black","red"/),
control the line colors.
xyLineThicknesses = (/1.0,2.0/),
Controls the line thicknesses.
xyDashPatterns = (/0,0/), Controls
the line
dash patterns.
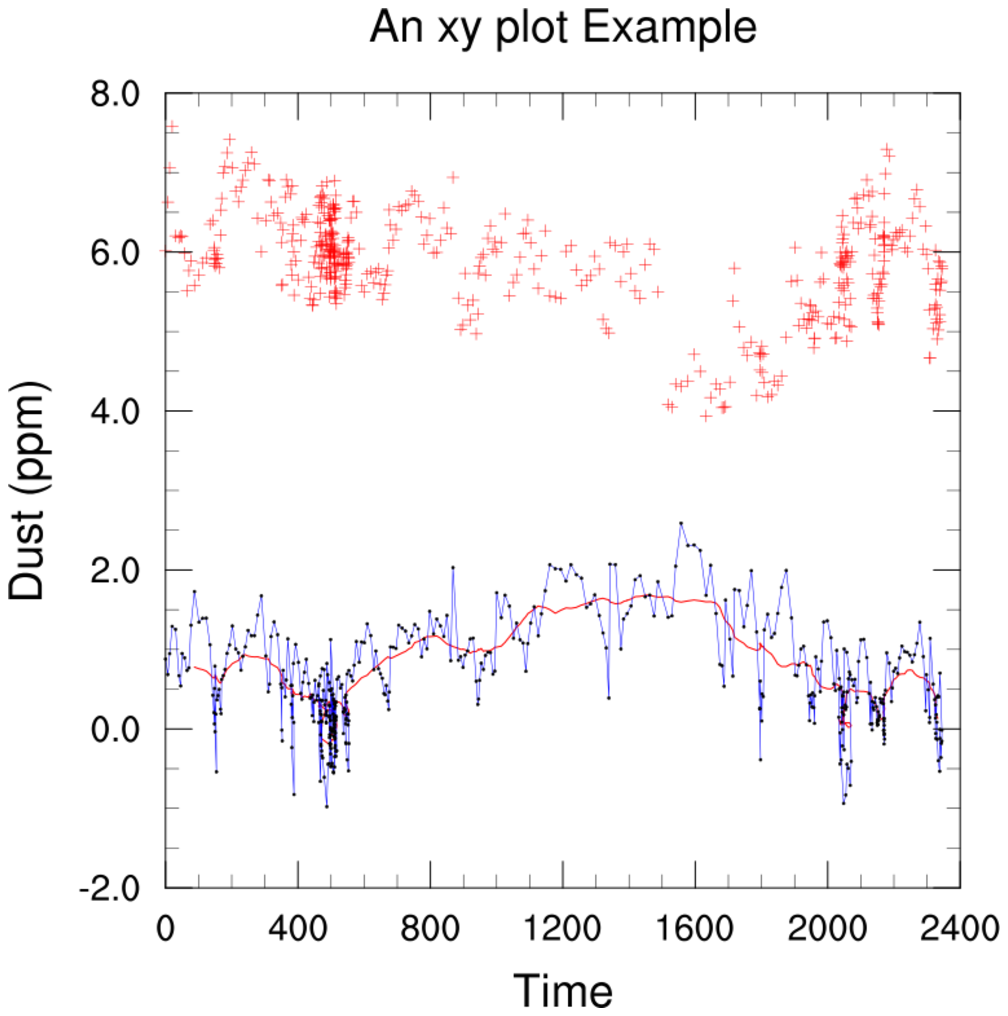 gsn_xy_4.ncl:
Demonstrates adding markers to lines.
gsn_xy_4.ncl:
Demonstrates adding markers to lines.
xyMarkLineModes =
(/"Markers","Lines","MarkLines"/), Controls whether each line on
the plot is represented soly by a line, by markers, or both.
xyMarkerColors = (/"red",
"black","black"/),Controls the colors of the markers. Note that we
fill out the array.
xyMarkers= (/2,0,1/), controls the
style of the
markers.
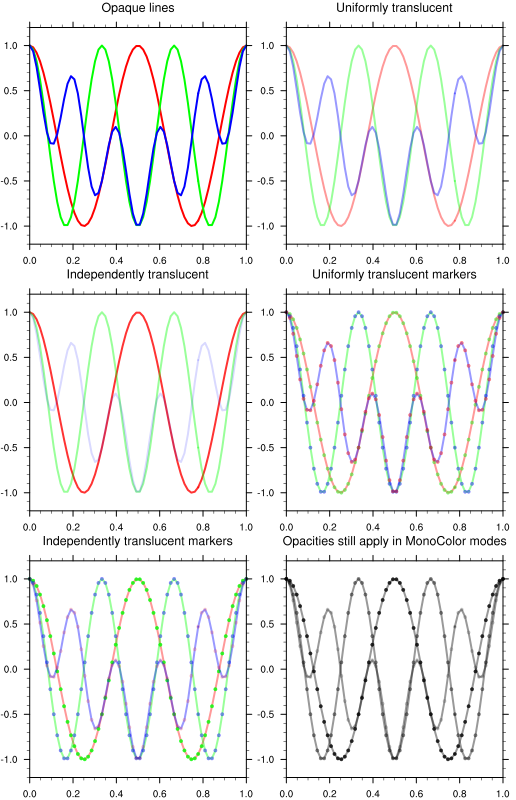 xy_35.ncl
: Illustrates the use of new XYPlot opacity resources (new with
NCL 6.4.0):
xy_35.ncl
: Illustrates the use of new XYPlot opacity resources (new with
NCL 6.4.0):
xyLineOpacityF
xyLineOpacities
xyMarkerOpacityF
xyMarkerOpacities