NCL Home>
Application examples>
Special plots ||
Data files for some examples
Example pages containing:
tips |
resources |
functions/procedures
NCL showcase page for Australian researchers
Page under construction.
This page showcases some NCL examples created by or for Australian
researchers. It is meant to be a companion page to the Oz wiki set up
by Mark Collier of CSIRO.
If you have an NCL visualization you would like to contribute
to this page, please email the NCL
admins and include or attach the following:
- your NCL script(s)
- a PostScript file with no more than three frames
- a brief explanation of your example (and optionally, yourself)
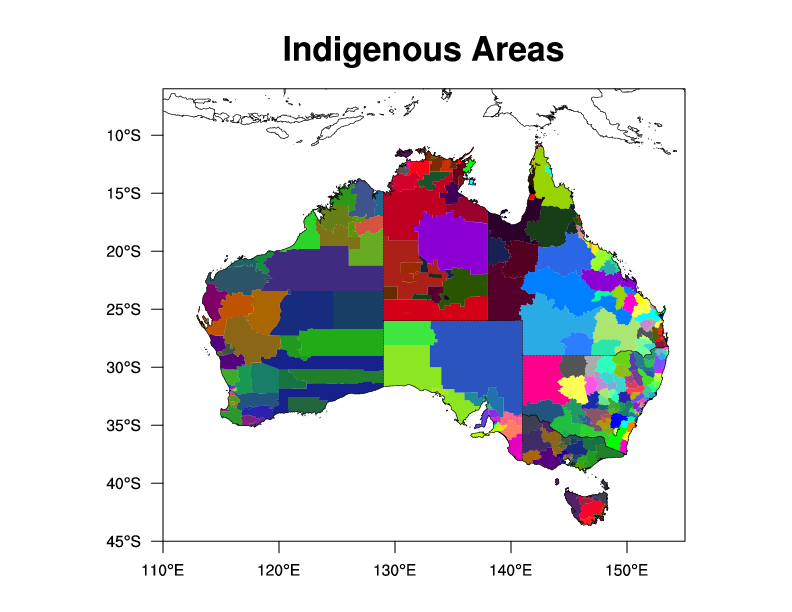
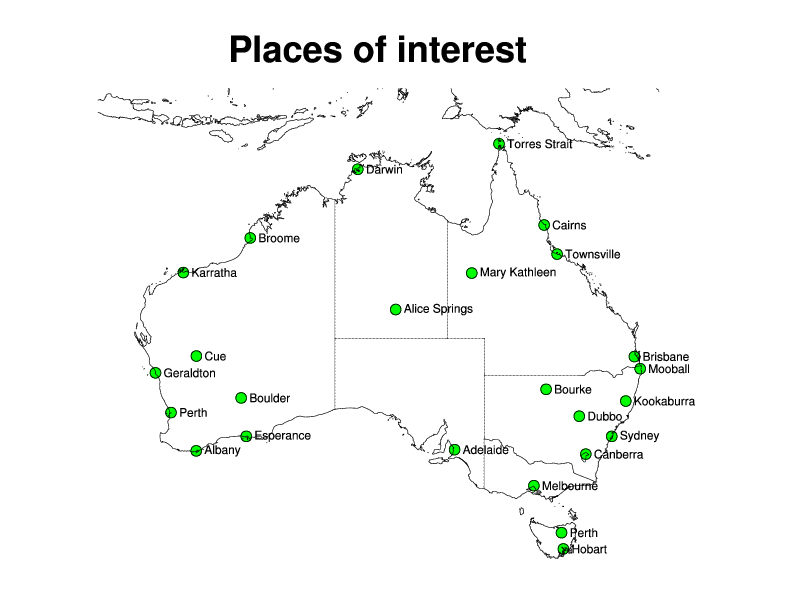
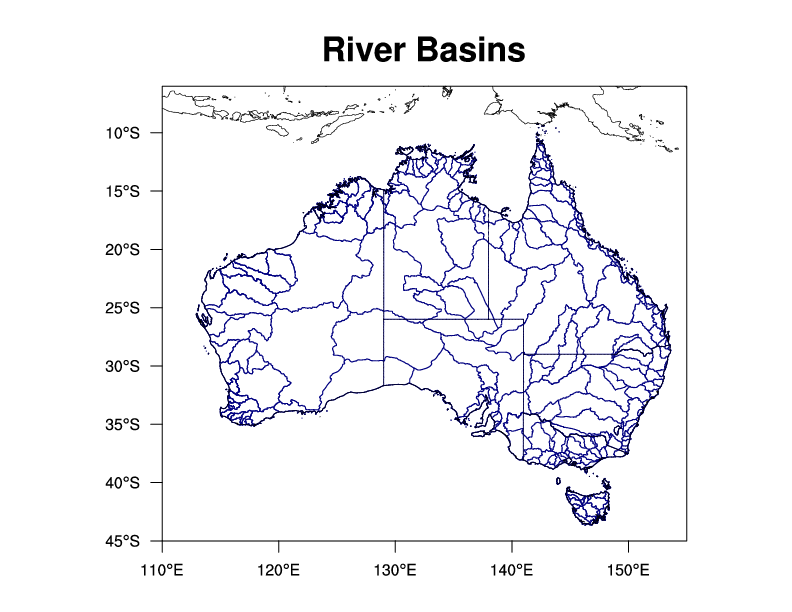
 oz_2.ncl
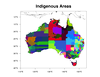
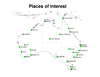
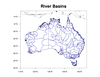
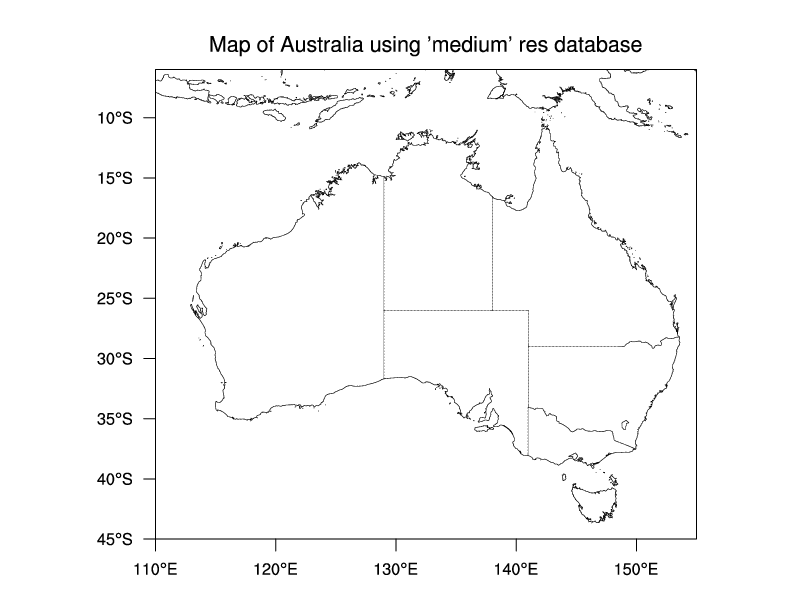
: This script shows
how you can use shapefile data to draw additional information
on a map, like rivers, city locations, and enclosed areas.
The shapefiles for this example were all free. See the comments in
the script for details.
