NCL > Application examples > Basic examples
ContourPlot example 12
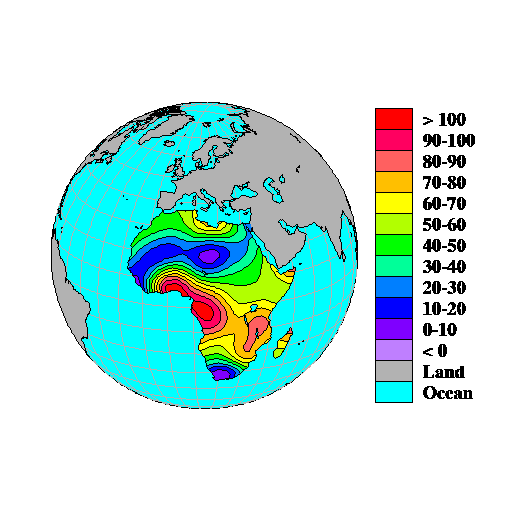
Drawing filled contours over a map of Africa
This example demonstrates how to use HLUs and NCL to create a masked, filled contour plot over a map of Africa. The names of the example codes that create this plot are cn12c.c, cn12f.f, and cn12n.ncl.
Discussion
Some of the resources are controlled through a resource file called cn12.res.A detailed discussion about how to create the plot appears in the comments of the source code for the example.
Creating the plot using HLU C library calls
The HLU C program that generates this plot is called cn12c.c.
Creating the plot using HLU FORTRAN library calls
The HLU FORTRAN program that generates this plot is called cn12f.f.
Creating the plot using NCL
The NCL script that generates this plot is called cn12n.ncl.
The data
The data for this example are generated using the GENDAT subroutine. However, the NCL script reads data from an ASCII data file called cn12n.asc.
How to run this example
The examples are installed in the following locations:
- $NCARG_ROOT/lib/ncarg/hluex/contourplot/cn12c.c
- $NCARG_ROOT/lib/ncarg/hluex/contourplot/cn12f.f
- $NCARG_ROOT/lib/ncarg/nclex/contourplot/cn12n.ncl
- $NCARG_ROOT/lib/ncarg/resfiles/contourplot/cn12.res
- $NCARG_ROOT/lib/ncarg/data/asc/cn12n.asc
