NCL Home>
Application examples>
Data sets ||
Data files for some examples
Example pages containing:
tips |
resources |
functions/procedures
NCL Graphics: Arctic System Reanalysis (ASR)
The Arctic System Reanalysis (ASR) is a
product created by the Polar Research Group at the Byrd Polar Research Center
(Ohio State University). The 30-km version is complete and is available via NCAR's
Research Data Archive ds631.0.
As noted at the RDA website:
The Arctic System Reanalysis (ASR) is produced using a high-resolution version of the Polar Weather Forecast Model (PWRF) and High Resolution Land Data Assimilation (HRLDAS) systems that have been optimized for the Arctic. The final version of 30 km horizontal resolution data set which spans 2000-2012 is released in September 2014 and available on line through the NCAR's RDA. The interim version, released in May 2012, is also available for a limited period of time.
The ASR-30km has 29 pressure levels, 27 surface and 10 upper air analysis variables, 74 surface and 16 upper air forecast variables, and 3 soil variables. Both the u- and v- winds relative to grid and relative to earth are present in the final version. The wind speed is also added.
There are two unusual aspects about the files: (a) Sea Surface Temperature (SST) have
values set to 0.0 over land. (See Example 4); and, (b) the pressure level variable is
not a netCDF 'coordinate variable'. It must be created manually. (See Example 3)
 asr_1.ncl
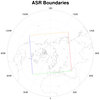
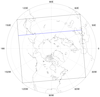
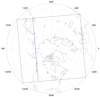
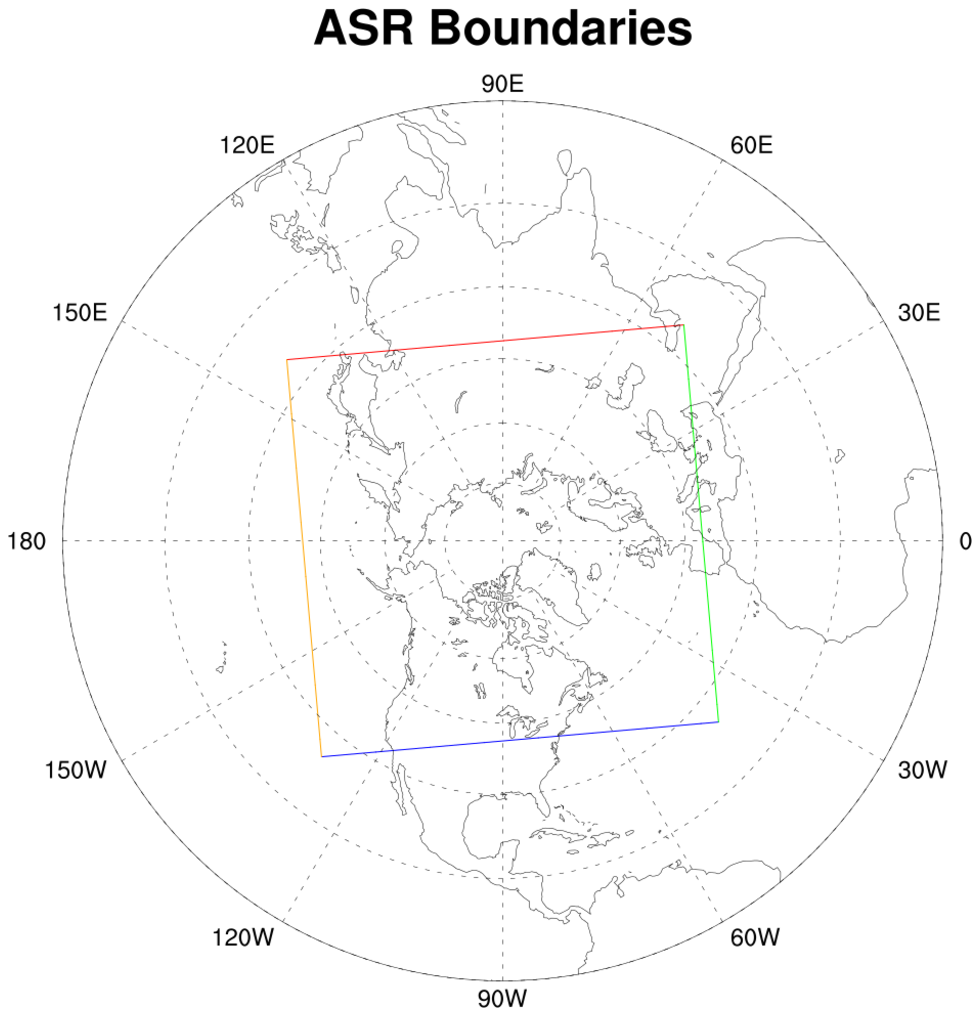
:
A simple plot that outlines the area covered by the ASR 30-km data set. The lines are colored so
that users can see how the latitude/longitudes may be accessed via indexing.
Also demonstrated is the map ('mp') resource that can be used to center the map.
 asr_2.ncl
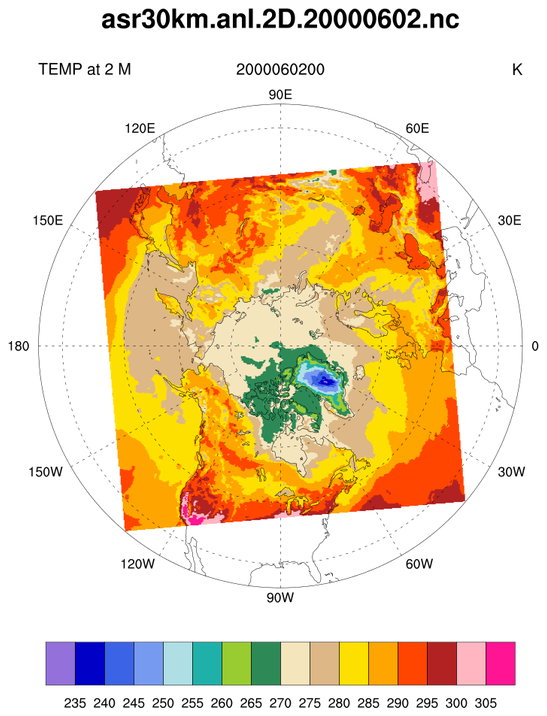
:
Read and plot an individual 2D variable on a polar stereographic projection.
 asr_3.ncl
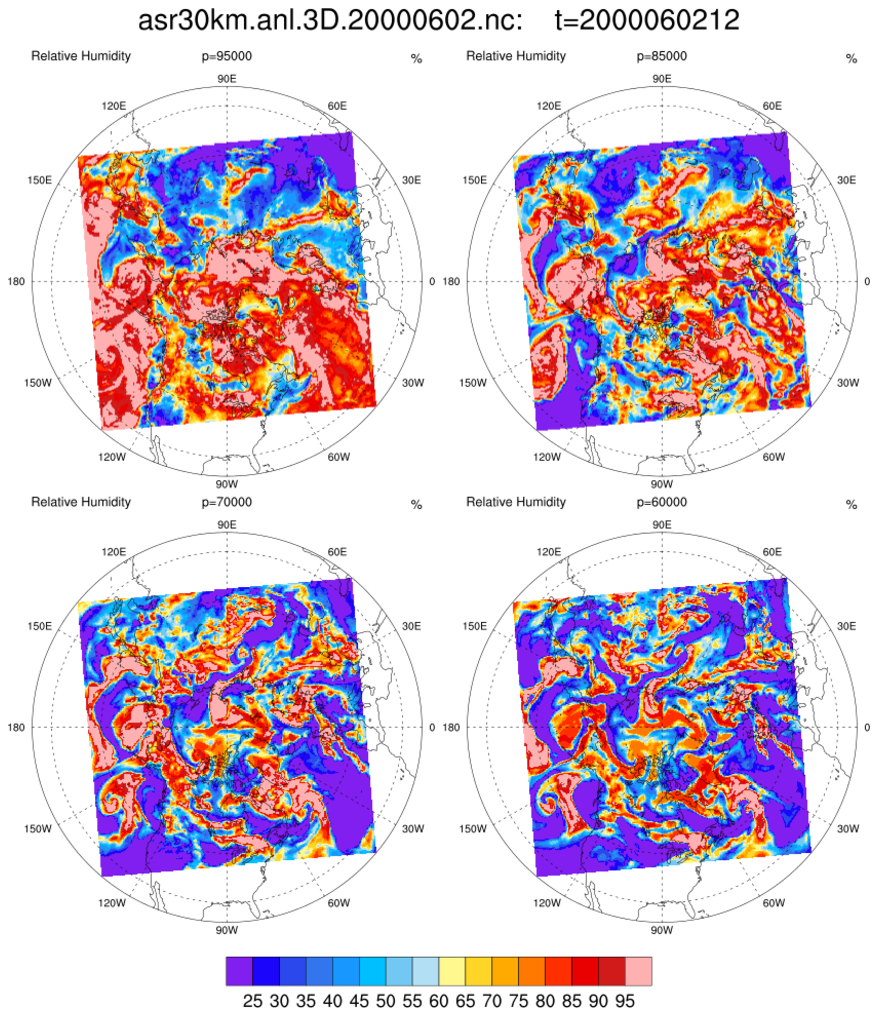
:
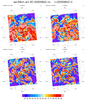
Read and plot a multilevel variable on a polar stereographic projection.
Here four arbitrarily selected levels are plotted as a panel. A vertical
'coordinate variable' is manually created. This facilitates accessing the data
at specific levels via 'natural coordinates' rather than index values.
 asr_4.ncl
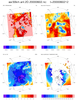
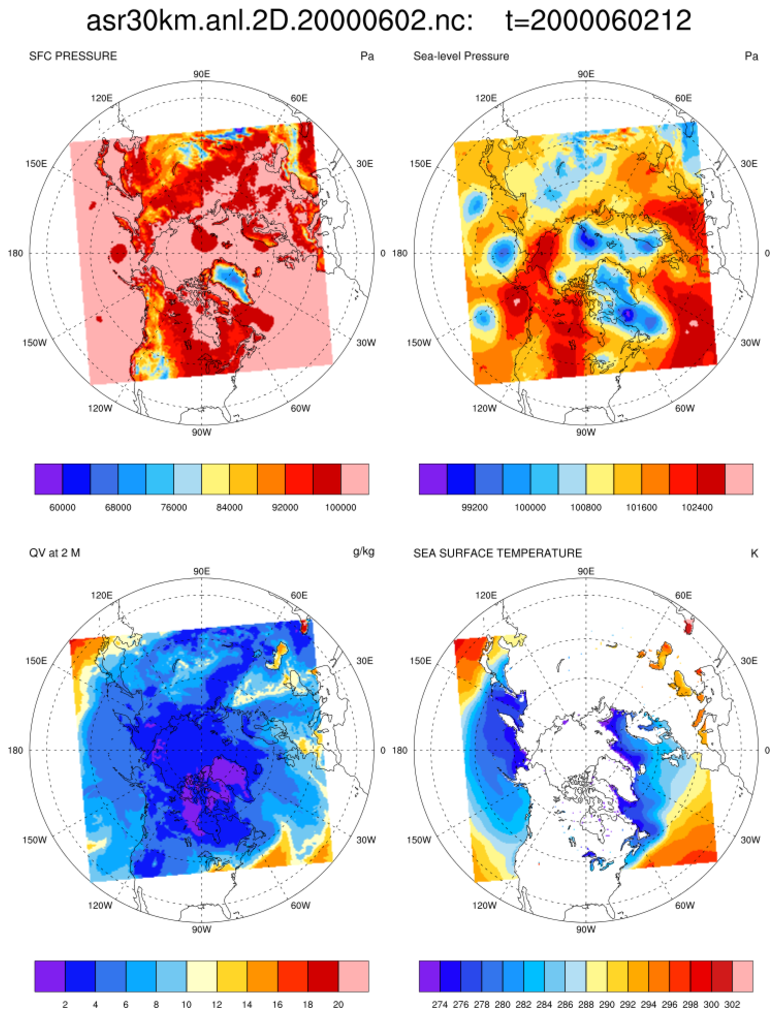
:
Read and plot four single level variables on a polar stereographic projection.
Unfortunately, the
SST variable has grid points over land set to 0.0.
Really, the _FillValue should have been set to 0.0. Here, the 'LANDMASK' variable
is used to set the SST over land to _FillValue.
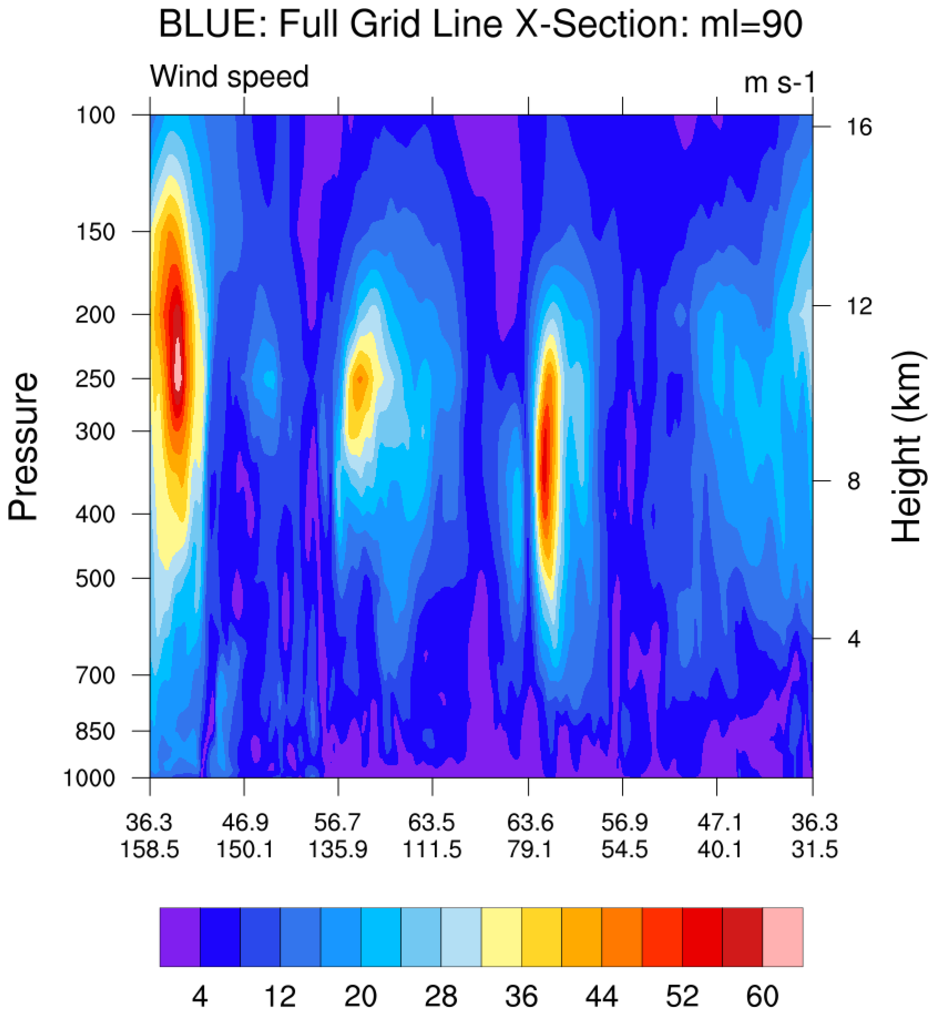
 asr_5.ncl
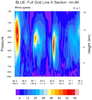
:
Draw a vertical cross section where the blue line indicates.
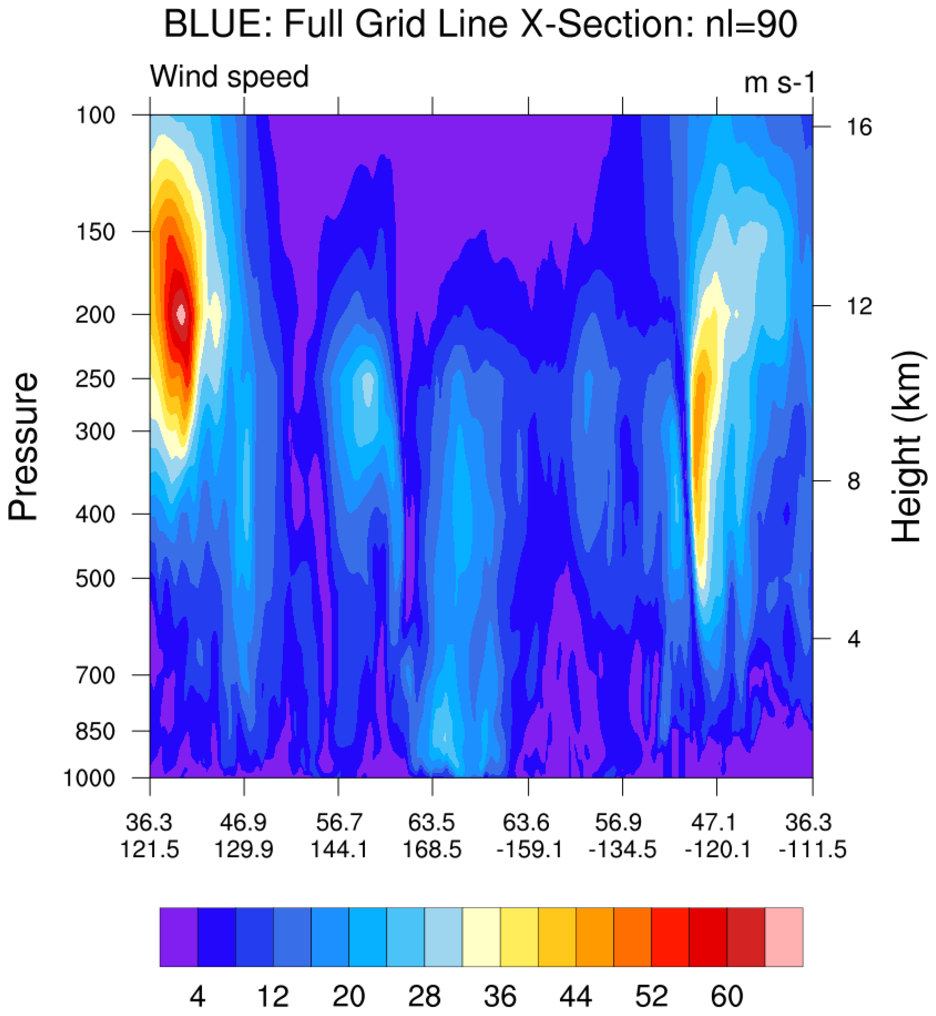
 asr_6.ncl
:
Draw a vertical cross section where the blue line indicates.


