This page illustrates some simple applications of these functions.
NCL Home>
Application examples>
Data Analysis ||
Data files for some examples
 climo_0.ncl: Compute monthly climatologies
and the monthly interannual variabilities using contributed functions
clmMonTLL and
clmStdTLL.
Built-in functions used: cd_calendar, ind
climo_0.ncl: Compute monthly climatologies
and the monthly interannual variabilities using contributed functions
clmMonTLL and
clmStdTLL.
Built-in functions used: cd_calendar, ind
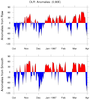
 climo_1.ncl: Compute decadal means
and standard deviation for SLP for two different decades, compute the
t-statistic, and plot the 5% level as stippling.
climo_1.ncl: Compute decadal means
and standard deviation for SLP for two different decades, compute the
t-statistic, and plot the 5% level as stippling.
 climo_2.ncl: Calculates monthly
climatologies and then conducts an eof analysis.
climo_2.ncl: Calculates monthly
climatologies and then conducts an eof analysis.
 climo_3.ncl: Demonstrates the use of
clmMonLLT and stdMonTLL to derive climatology and the
interannual variability. Though this example derives the climatology
based on the entire time period, a subset may be used by using either
conventional subscripting or coordinate dimensions.
climo_3.ncl: Demonstrates the use of
clmMonLLT and stdMonTLL to derive climatology and the
interannual variability. Though this example derives the climatology
based on the entire time period, a subset may be used by using either
conventional subscripting or coordinate dimensions.
 climo_5.ncl:
Calculate the daily mean annual cycle and daily anomalies from the mean
annual cycle. For illustration: (a) compute raw and smoothed annual cycles;
(b) create a netCDF file of the daily anomalies; (c) plot results.
climo_5.ncl:
Calculate the daily mean annual cycle and daily anomalies from the mean
annual cycle. For illustration: (a) compute raw and smoothed annual cycles;
(b) create a netCDF file of the daily anomalies; (c) plot results.
 climo_6.ncl:
(a) Read files containing year-month data,
(b) create climatologies spanning user specified years
(c) plot November-April and May-October climatologies
over a user specified region
climo_6.ncl:
(a) Read files containing year-month data,
(b) create climatologies spanning user specified years
(c) plot November-April and May-October climatologies
over a user specified region
Example pages containing: tips | resources | functions/procedures
NCL: Climatology
There are numerous climatological functions that compute
daily and monthly climatologies; calculate anomalies from the climatologies;
remove monthly and daily annual cycles, and, calculate interannual variabilities.
For historical reasons, some of these function names end in
TLL, TLLL, LLT, LLLT. They refer
to expected input array ordering (nominally):
(time,lat,lon), (time,lev,lat,lon),
(lat,lon,time), (lev,lat,lon,time), respectively.
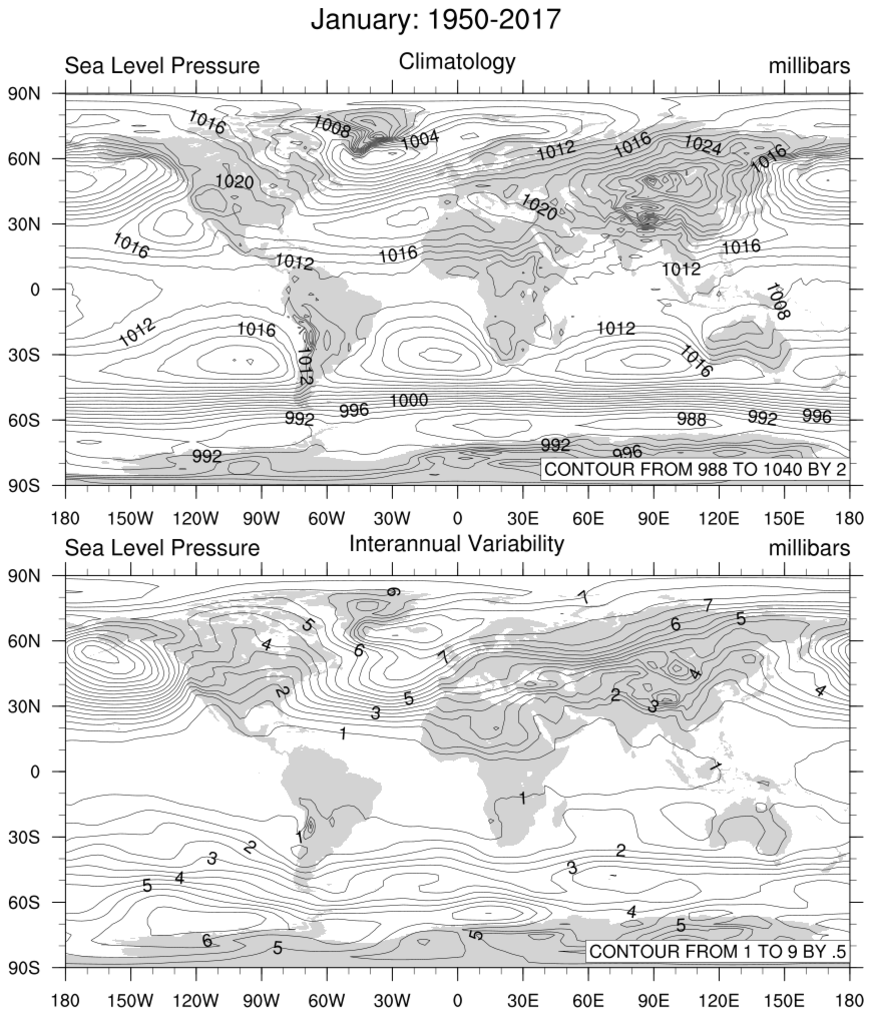
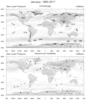
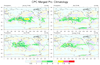
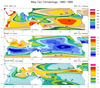
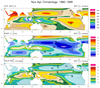
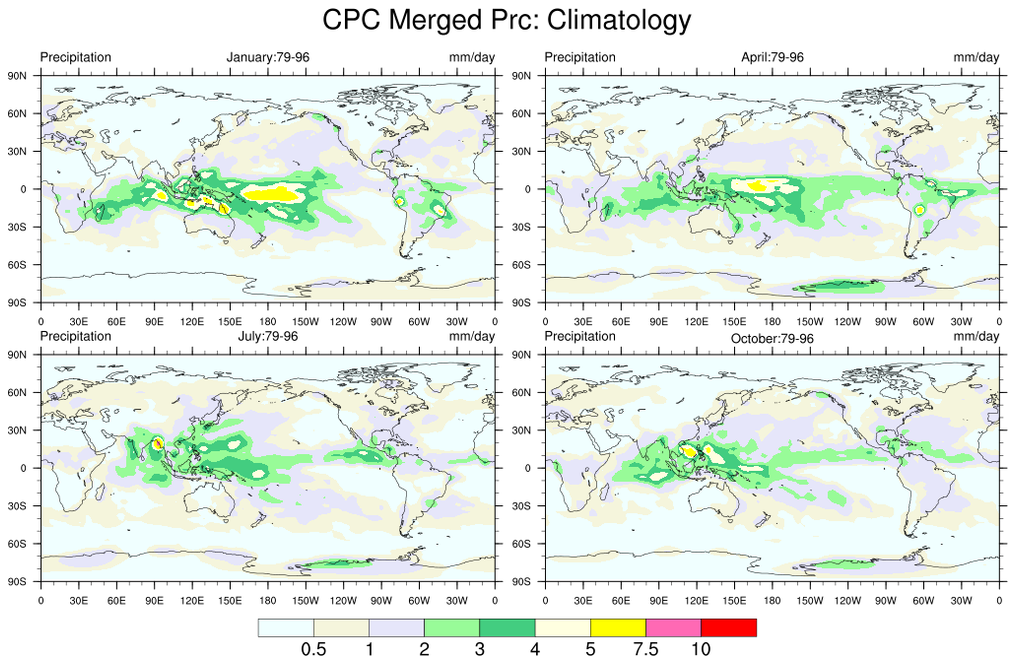
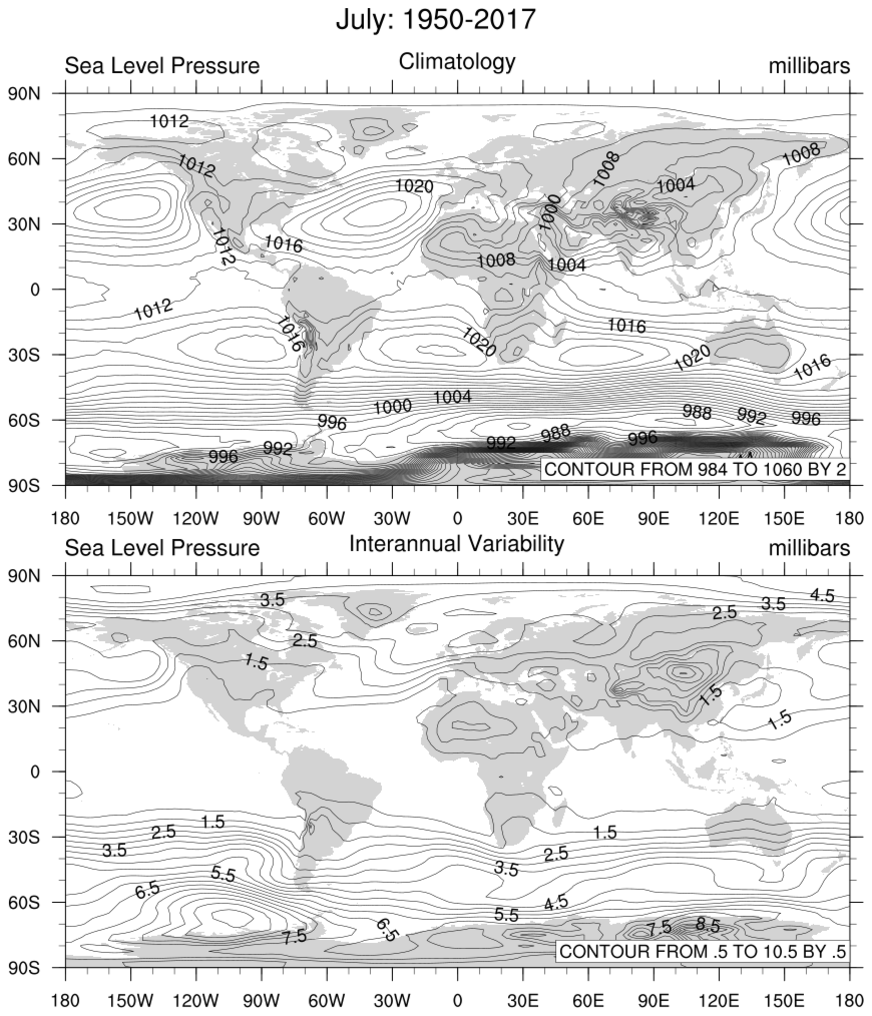 climo_0.ncl: Compute monthly climatologies
and the monthly interannual variabilities using contributed functions
clmMonTLL and
clmStdTLL.
Built-in functions used: cd_calendar, ind
climo_0.ncl: Compute monthly climatologies
and the monthly interannual variabilities using contributed functions
clmMonTLL and
clmStdTLL.
Built-in functions used: cd_calendar, ind
Only the January and July climaytologies are displayed.
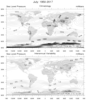
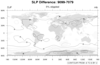
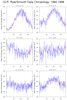
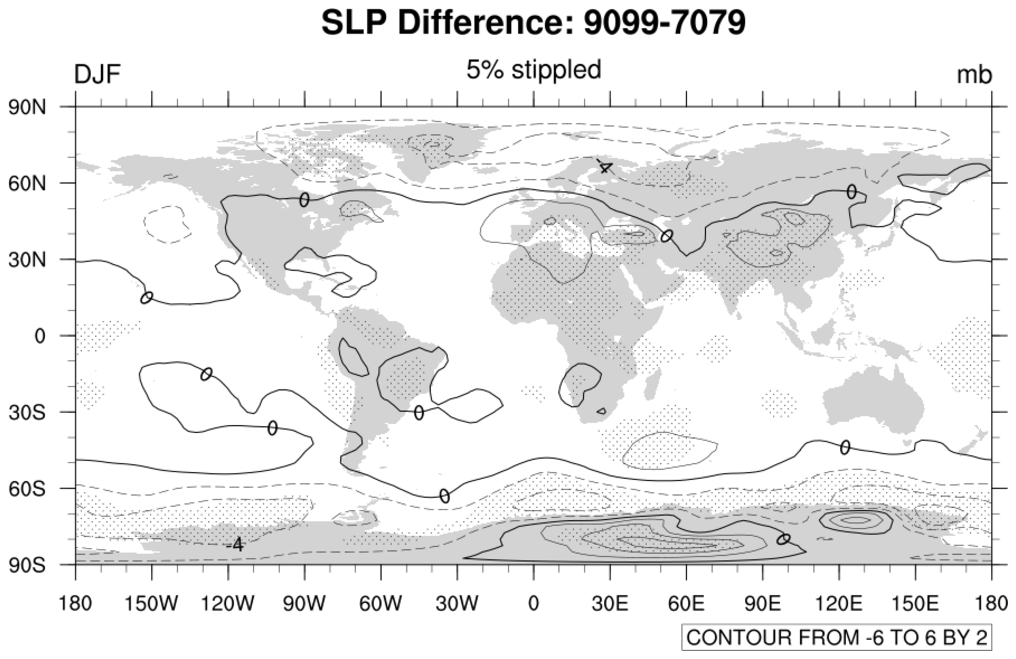 climo_1.ncl: Compute decadal means
and standard deviation for SLP for two different decades, compute the
t-statistic, and plot the 5% level as stippling.
climo_1.ncl: Compute decadal means
and standard deviation for SLP for two different decades, compute the
t-statistic, and plot the 5% level as stippling.
Built-in functions used: ttest, ind.
Contributed functions used: clmMonTLL, stdMonTLL, copy_VarCoords. runave_n_Wrap.
Shea_util functions used: ShadeLtContour.
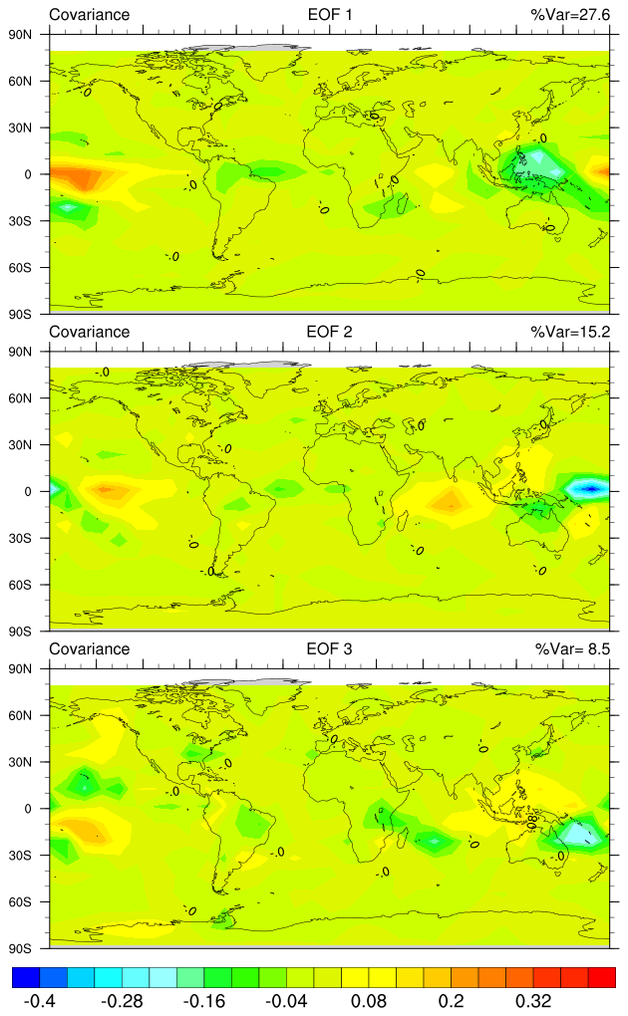
 climo_2.ncl: Calculates monthly
climatologies and then conducts an eof analysis.
climo_2.ncl: Calculates monthly
climatologies and then conducts an eof analysis.
Built-in functions used: runave, dimsizes.
Contributed functions used: clmMonLLT, stdMonLLT, eofcov_ts_Wrap.
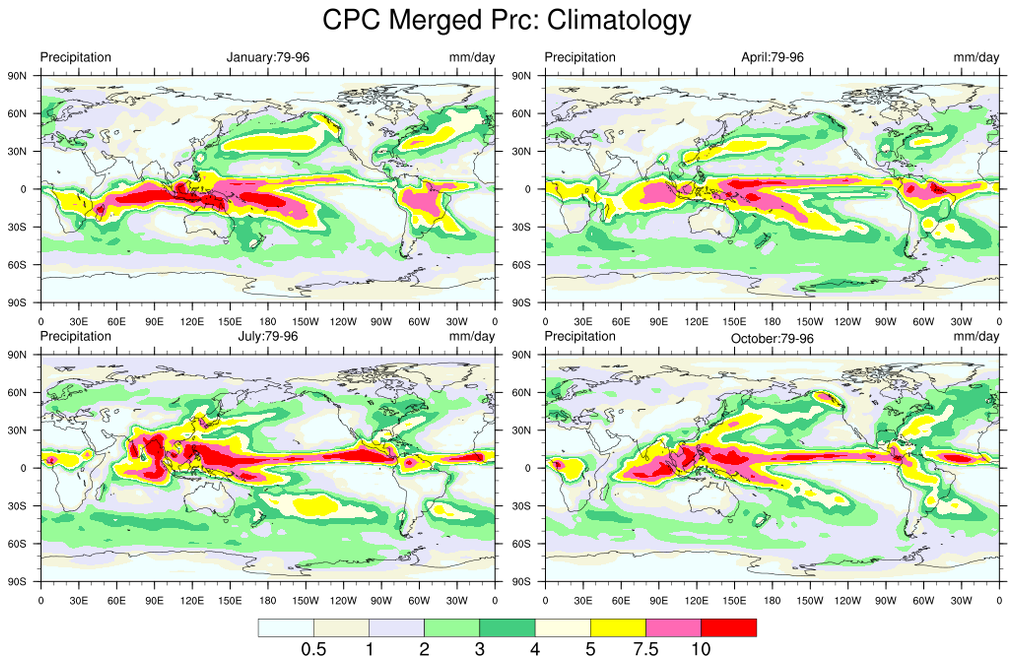
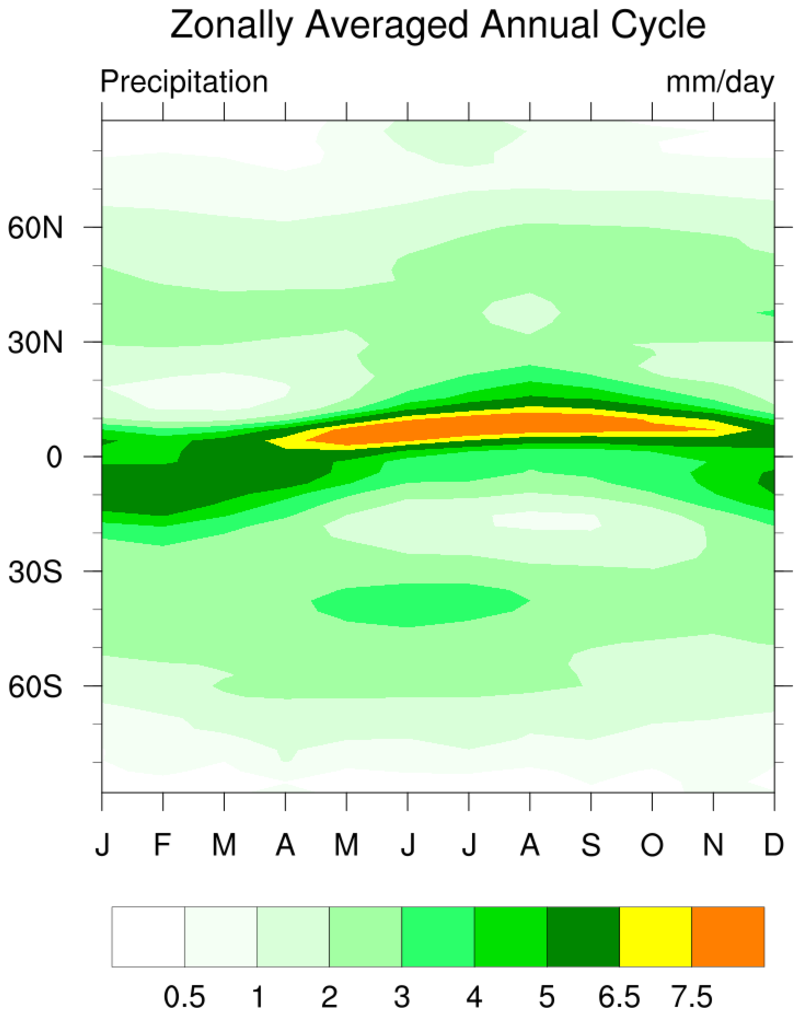
 climo_3.ncl: Demonstrates the use of
clmMonLLT and stdMonTLL to derive climatology and the
interannual variability. Though this example derives the climatology
based on the entire time period, a subset may be used by using either
conventional subscripting or coordinate dimensions.
climo_3.ncl: Demonstrates the use of
clmMonLLT and stdMonTLL to derive climatology and the
interannual variability. Though this example derives the climatology
based on the entire time period, a subset may be used by using either
conventional subscripting or coordinate dimensions.
To get the climatology for Jan 1980 through Dec 1989 for this dataset:
prcClm = clmMonTLL (prc(12:131,:,:)), using conventional subscripts.
or prcClm = clmMonTLL (prc({198001:198912},:,:)), using coordinate subscripting.
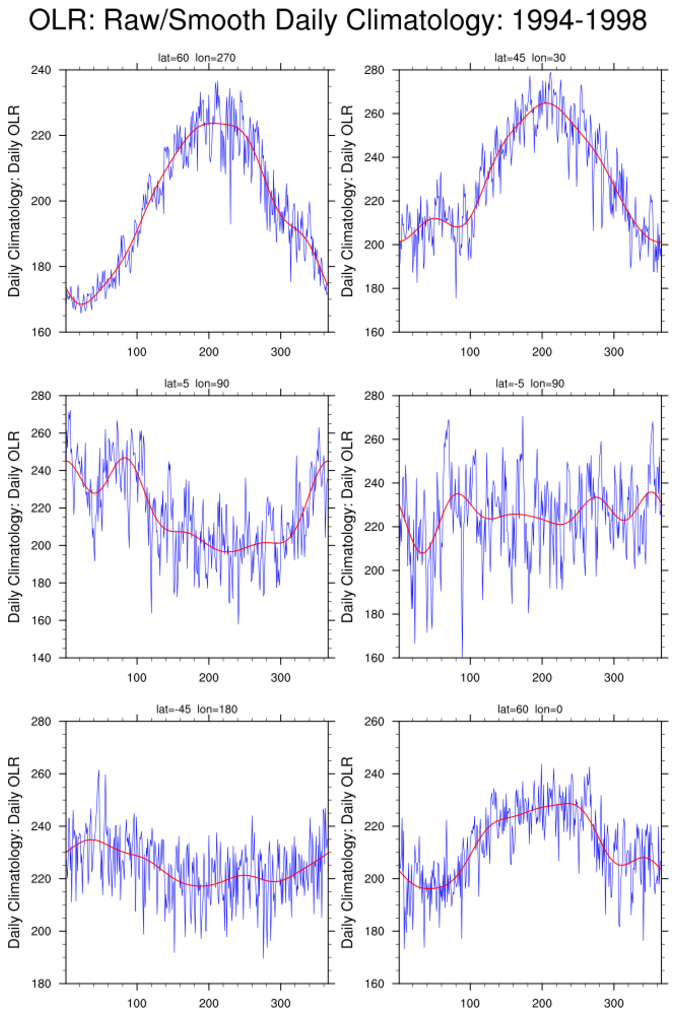
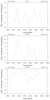
 climo_5.ncl:
Calculate the daily mean annual cycle and daily anomalies from the mean
annual cycle. For illustration: (a) compute raw and smoothed annual cycles;
(b) create a netCDF file of the daily anomalies; (c) plot results.
climo_5.ncl:
Calculate the daily mean annual cycle and daily anomalies from the mean
annual cycle. For illustration: (a) compute raw and smoothed annual cycles;
(b) create a netCDF file of the daily anomalies; (c) plot results.
This example only uses 5-years of data. Hence, there is considerable day-to-day variability in this example.
Which is the proper daily annual cycle to use: raw or smoothed? It depends on your usage. The smoothed annual cycle can be thought of as the values that would be obtained if there was an infinite ensemble of data under the same forcing conditions.
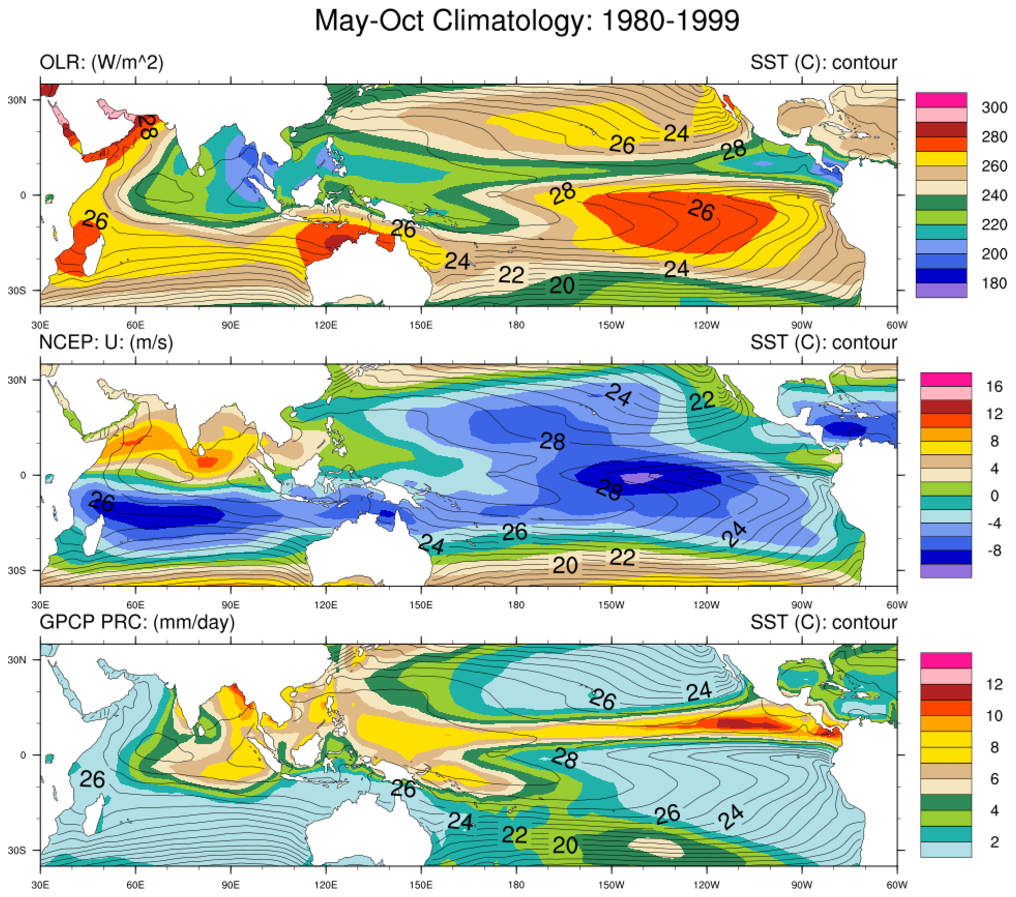
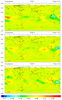
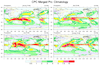
 climo_6.ncl:
(a) Read files containing year-month data,
(b) create climatologies spanning user specified years
(c) plot November-April and May-October climatologies
over a user specified region
climo_6.ncl:
(a) Read files containing year-month data,
(b) create climatologies spanning user specified years
(c) plot November-April and May-October climatologies
over a user specified region