Some sample symmetric color tables include:
| BlueRed | BlRe | GreenYellow |
| 
| 
|
Some sample symmetric color tables include:
| BlueRed | BlRe | GreenYellow |
|
|
|
|
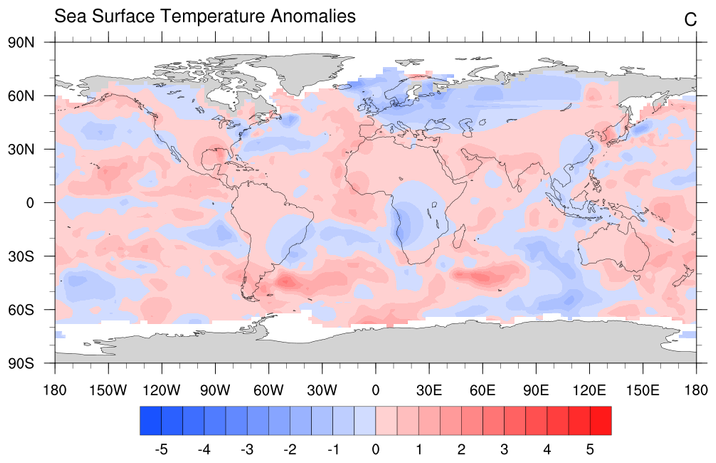
contoursym_1.ncl:
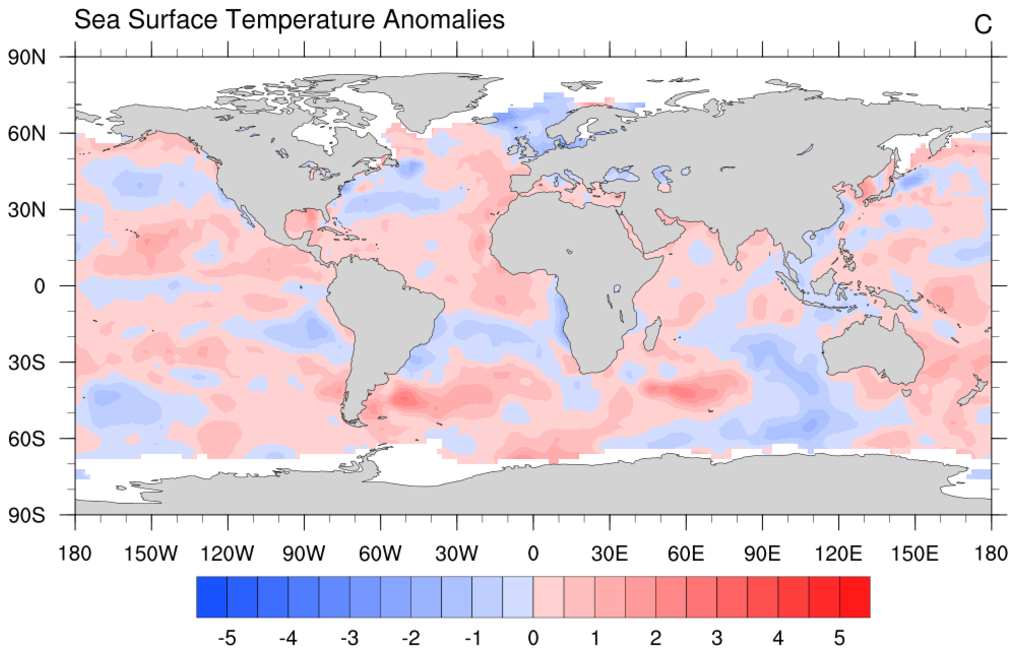
If you have a symmetric color table (an equal number of colors in each
range, like
the BlueRed
color map), and you provide a set of contour levels that go from -X to X,
then you will automatically get a nice symmetric set of colors above
and below 0.0, because NCL will automatically span your color map.
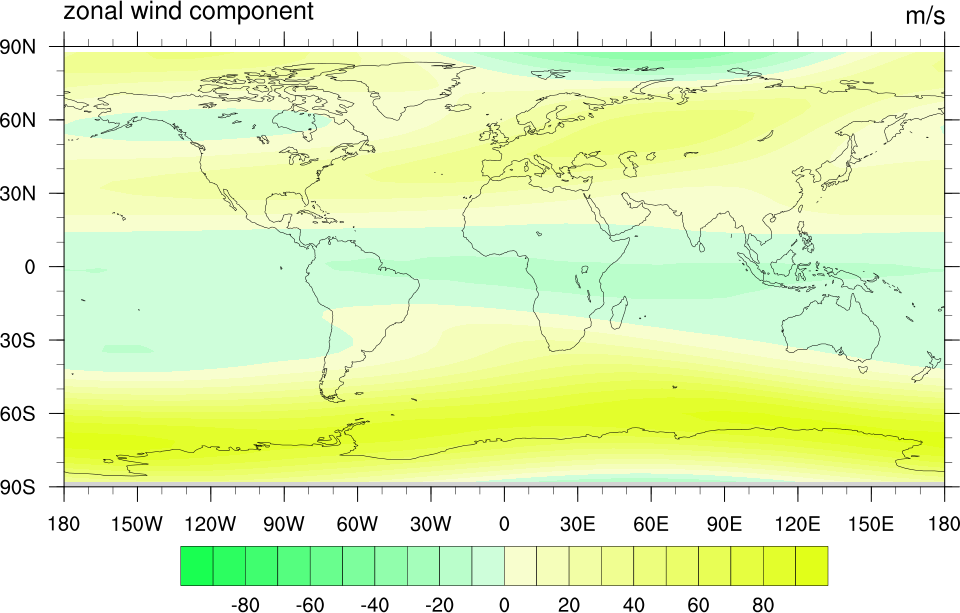
 contoursym_2.ncl:
This example is identical to the one above, except that
mpFillDrawOrder
is set to "PostDraw" so that you see the gray filled
land on top of the filled contours.
contoursym_2.ncl:
This example is identical to the one above, except that
mpFillDrawOrder
is set to "PostDraw" so that you see the gray filled
land on top of the filled contours.
 contoursym_3.ncl:
If you don't know the range of your data apriori, but you want to make
sure the contour levels go from -X to X in steps
of xint, then you can
use symMinMaxPlt.
contoursym_3.ncl:
If you don't know the range of your data apriori, but you want to make
sure the contour levels go from -X to X in steps
of xint, then you can
use symMinMaxPlt.
This procedure sets the following resources:
res@cnLevelSelectionMode = "ManualLevels"
res@cnMinLevelValF = -X
res@cnMaxLevelValF = X
res@cnLevelSpacingF = xint
 contoursym_4.ncl:
This script, which was contributed by Chad Herman, calculates the
proper values of gsnSpreadColorStart
and gsnSpreadColorEnd for a two-color
color table to ensure such that negative values will be in the first
range of colors, and positive values will be in the second range of
colors.
contoursym_4.ncl:
This script, which was contributed by Chad Herman, calculates the
proper values of gsnSpreadColorStart
and gsnSpreadColorEnd for a two-color
color table to ensure such that negative values will be in the first
range of colors, and positive values will be in the second range of
colors.
You can tweak the plotting limits to see how well the code correctly calculates the gsnSpreadColorStart/End values. Note that if the color bar spacing is larger than the value where you want blue to transition to red, the transition will not occur at the intended value because it's too small to resolve.
Note: using gsnSpreadXXX resources is the older method of spanning a color map, which still works. You can also use cnFillPalette to directly associated colors with a contour plot.