Example pages containing: tips | resources | functions/procedures
NCL: Deviations from the Mean
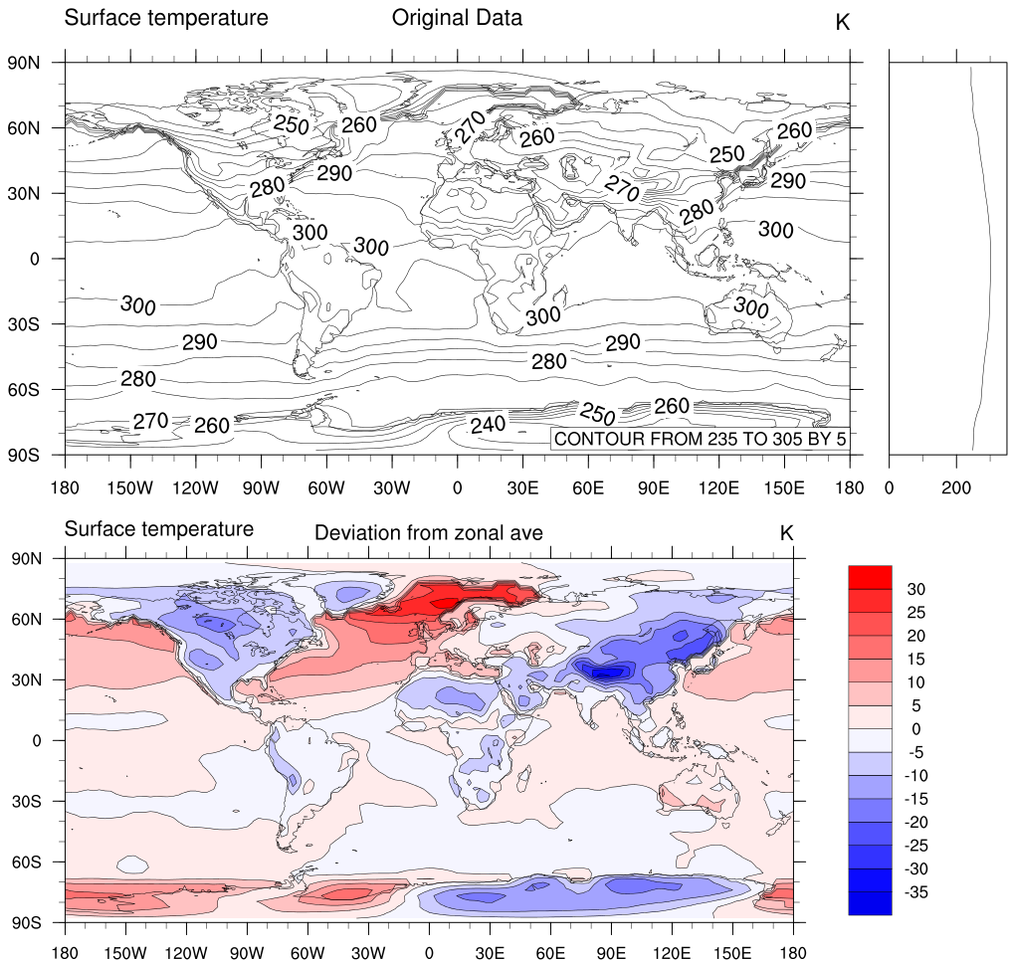 dev_1.ncl: Creates panel plot of TS data
and TS deviations from a zonal mean.
dev_1.ncl: Creates panel plot of TS data
and TS deviations from a zonal mean.
TS is dimensioned (/"time","lat","lon"/)
dim_rmvmean is the built-in NCL function that will calculate deviations from a mean. This function first calculates the mean of the data using dim_avg, and then subtracts that mean from the original data. Since dim_avg operates on the rightmost dimension, dim_rmvmean results in the deviation from the zonal mean.
A Python version of this projection is available here.
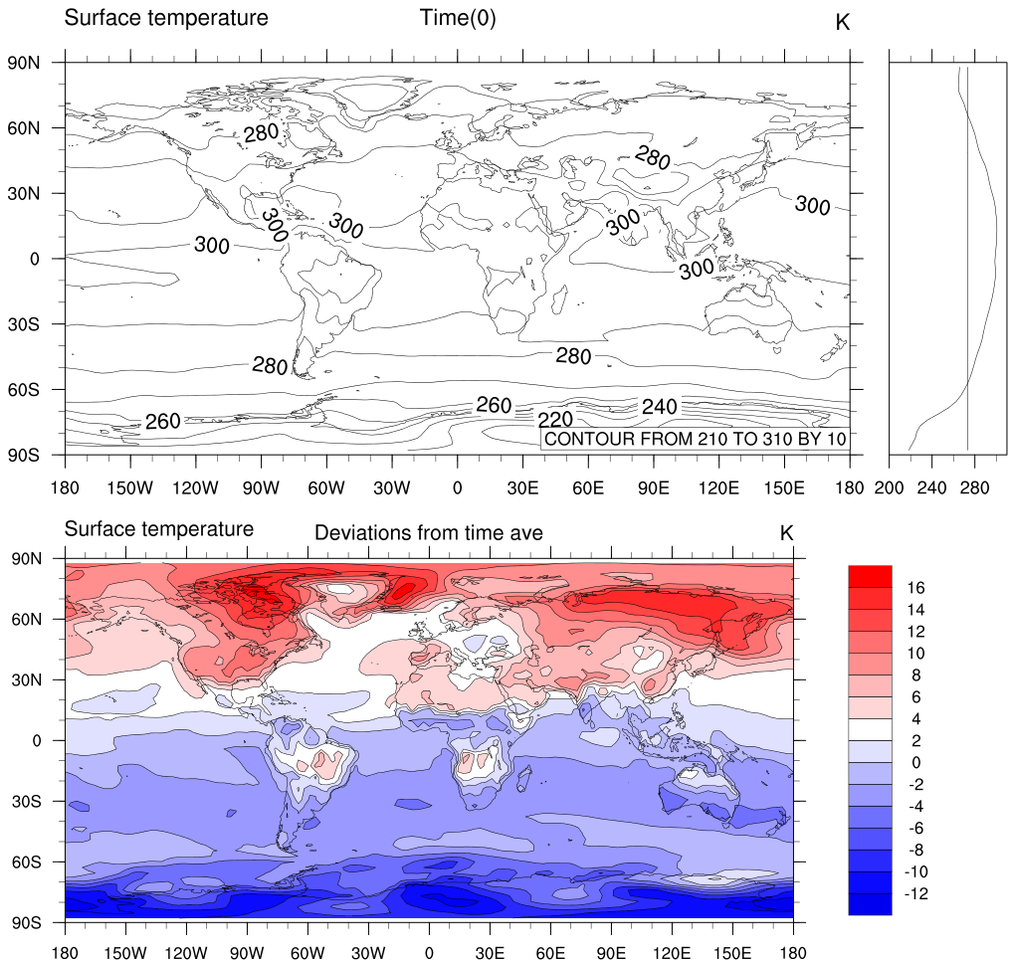 dev_2.ncl: Reorders the TS data so
that time is the rightmost dimension, which produces a deviation from
time plot. In version 5.1.1, you will be able to
use dim_rmvmean_n
(dim_rmvmean_n_Wrap to preserve
metadata) to avoid having to reorder the data.
dev_2.ncl: Reorders the TS data so
that time is the rightmost dimension, which produces a deviation from
time plot. In version 5.1.1, you will be able to
use dim_rmvmean_n
(dim_rmvmean_n_Wrap to preserve
metadata) to avoid having to reorder the data.
The NCL syntax |: is called named subscripting, and it can
be used to efficiently reorder a data array:
anom = dim_rmvmean(ts(lat|:,lon|:,time|:)).
In version 5.1.1, you can use
anom = dim_rmvmean_n(ts,0).
The zonal average plot is modified by using gsnZonalMeanXMinF, gsnZonalMeanXMaxF, and gsnZonalMeanYRefLine to set the minimum X-axis value, the maximum X-axis value, and the X-axis value where the reference line will be drawn.
A Python version of this projection is available here.