NCL Home>
Application examples>
Models ||
Data files for some examples
Example pages containing: tips | resources | functions/procedures
NCL: HYCOM Model
From the HYCOM Consortium page:
The HYCOM consortium is a multi-institutional effort funded by the
National Ocean Partnership Program (NOPP), as part of the U. S. Global
Ocean Data Assimilation Experiment (GODAE), to develop and evaluate a
data-assimilative hybrid isopycnal-sigma-pressure (generalized)
coordinate ocean model (called HYbrid Coordinate Ocean Model or
HYCOM).
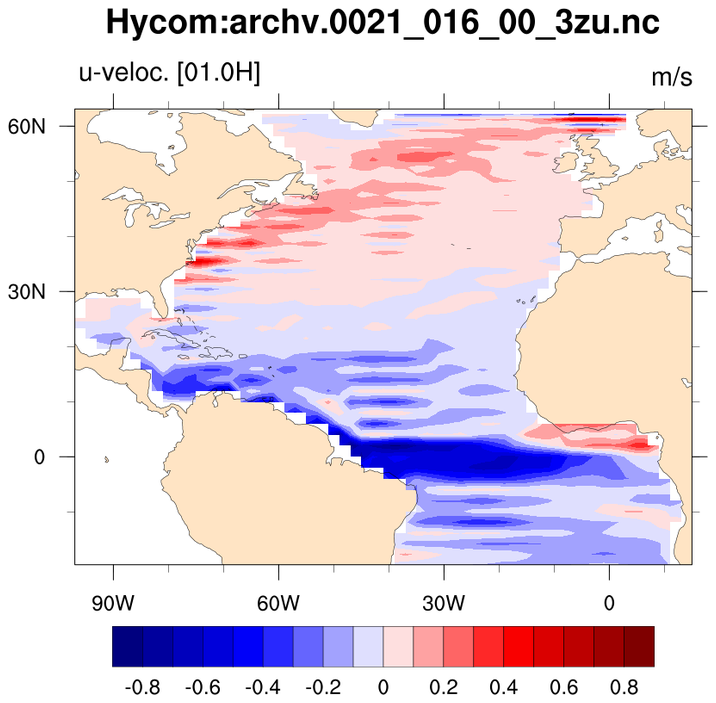
 hycom_1.ncl: A simple
color plot.
hycom_1.ncl: A simple
color plot.
gsn_csm_contour_map_ce
is the plot interface that creates a contour plot on a cylindrical
equidistant projection.
cFillOn = True, turns on the color while cnLinesOn = False, turns off the contour lines
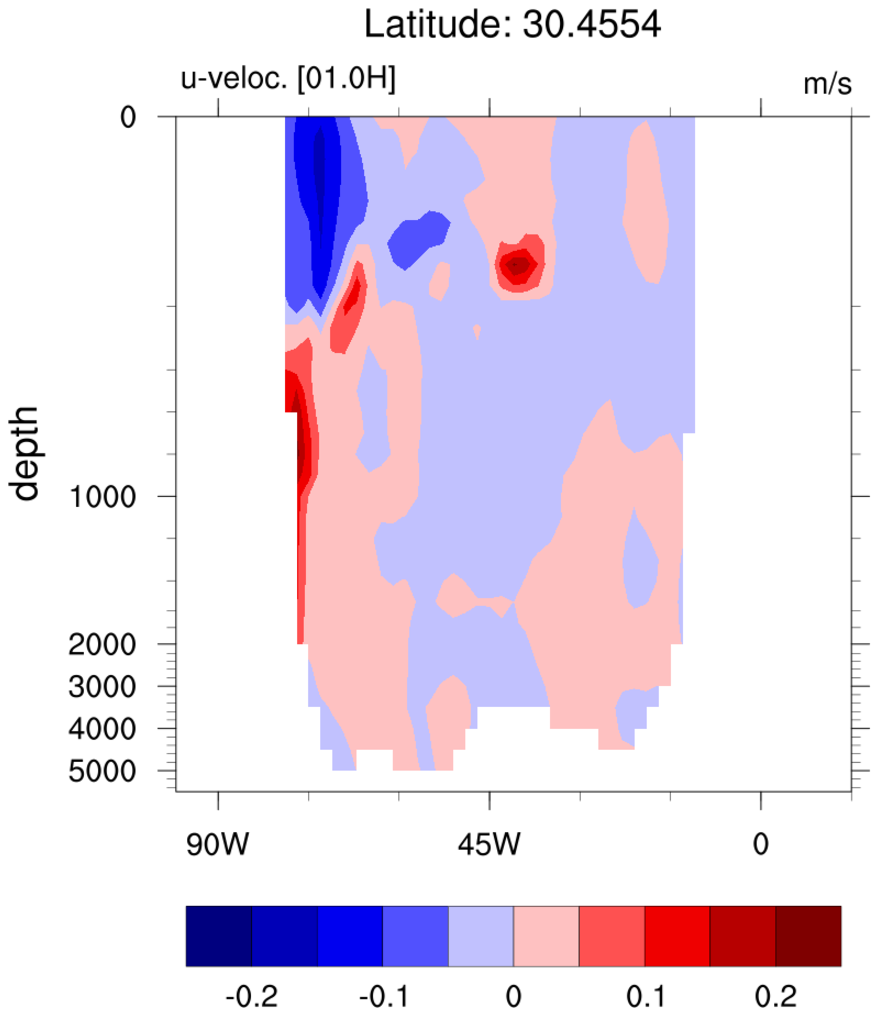 hycom_2.ncl: A slice plot.
gsn_csm_contour is the plot interface that creates a contour plot.
trYReverse is the resource that will reverse the y-axis.