NCAR's Climate Data Guide provides additional IBTrACS visualizations.
NCL Home>
Application examples>
Data sets ||
Data files for some examples
 ibtracs_3.ncl:
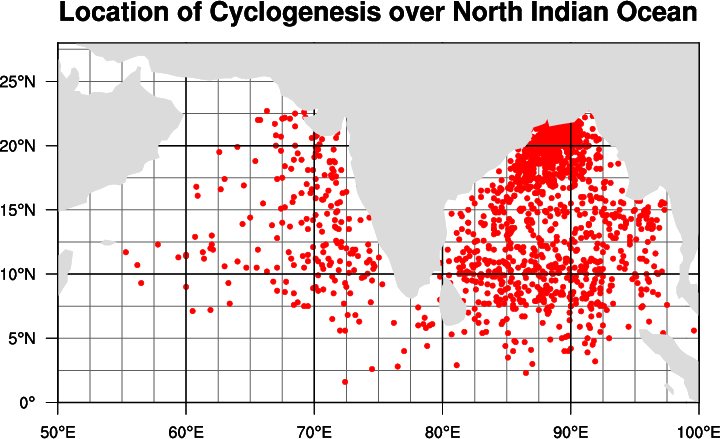
Storm cyclogenesis over the North Indian oceam. The points drawn are derived from the lon_for_mapping and lat_for_mapping variables
Example pages containing:
tips |
resources |
functions/procedures
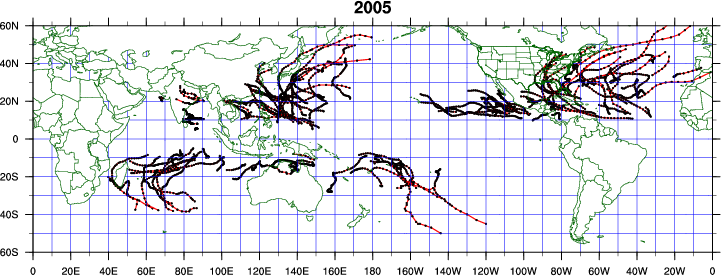
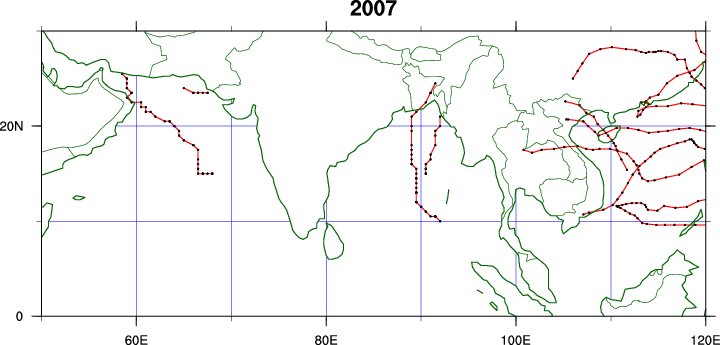
NCL Graphics: IBTrACS: International Best Track Archive for Climate Stewardship
The IBTrACS project combines information from numerous tropical cyclone datasets.
It contains the most complete global set of historical tropical cyclones available.
The data are available from here . Users should perform a 'ncdump -h' or 'ncl_filedump' on the
file(s) being used to become familiar with the information on the file(s).
There are other examples of tracking (storm, bouy, etc.) under the trajectories category.
 ibtracs_3.ncl:
 Storm cyclogenesis over the North Indian oceam. The points drawn are derived from the lon_for_mapping and lat_for_mapping variables
     short lat_for_mapping(storm, time) ;
                lat_for_mapping:long_name = "Latitude for mapping purposes only" ;
                lat_for_mapping:units = "degrees_north" ;
                lat_for_mapping:scale_factor = 0.01f ;
                lat_for_mapping:_FillValue = -32767s ;
     short lon_for_mapping(storm, time) ;
                lon_for_mapping:long_name = "Longitude for mapping purposes only" ;
                lon_for_mapping:units = "degrees_east" ;
                lon_for_mapping:scale_factor = 0.01f ;
                lon_for_mapping:_FillValue = -32767s ;
which must be unpacked (short2flt)
prior to use. These variables have dimensions (storm, time). Hence, the
NCL array syntax used in the script (:,0) means all storms at time 0 (initial time).
Contributed by Carl Schreck.