local_max calculates the local maxima.
NCL Home>
Application examples>
Data Analysis ||
Data files for some examples
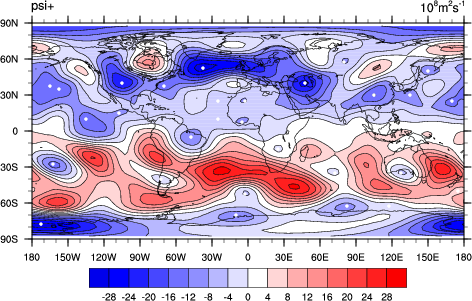
 minmax_1.ncl:
Calculates the local minima of some real world psi data and plots
the original data overlaid with white dots that represent the
location of each minima.
minmax_1.ncl:
Calculates the local minima of some real world psi data and plots
the original data overlaid with white dots that represent the
location of each minima.
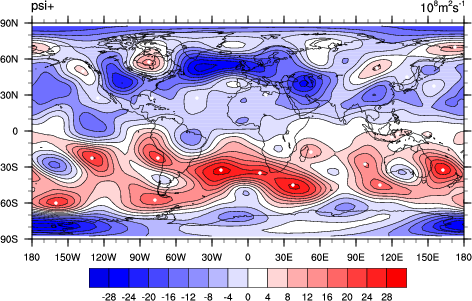
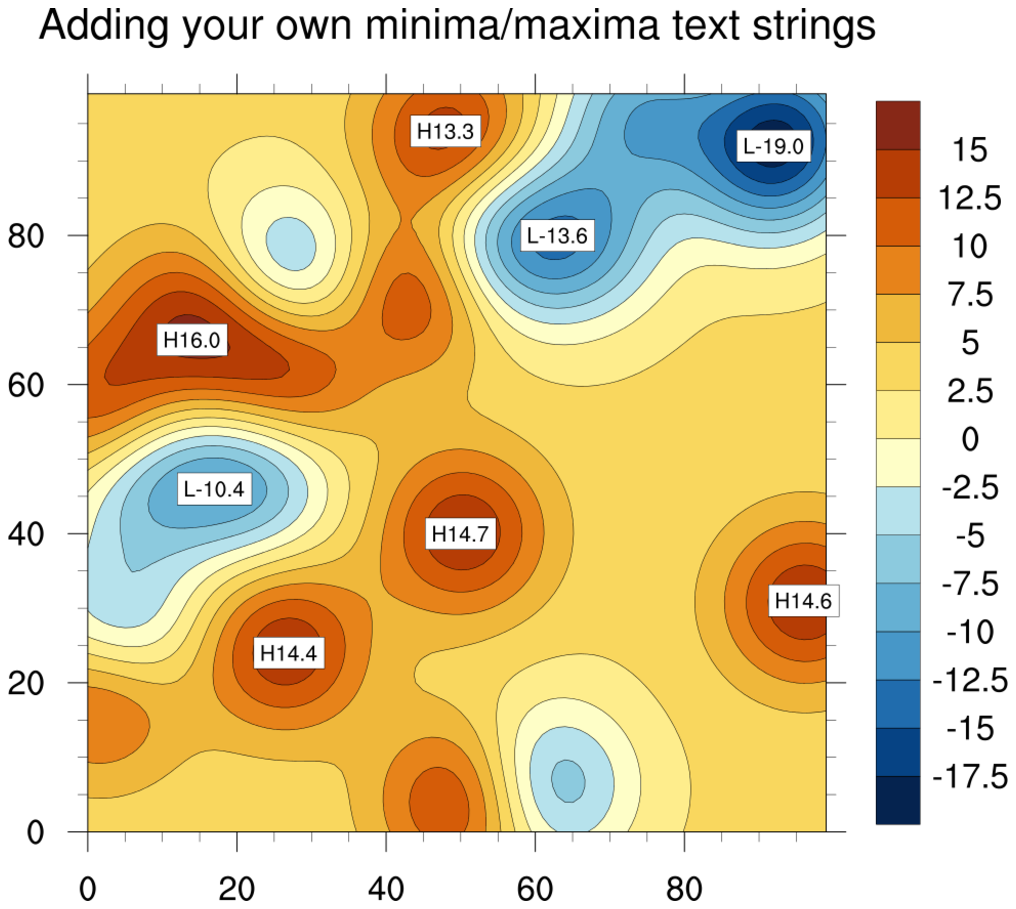
 minmax_4.ncl: Shows how to label
the minima and maximia on your plot using
gsn_add_polymarker. The
WhiteBlue
color map has 256 colors, so in order to use red and green markers,
you have to replace the two of the colors using
NhlSetColor. Also, in order to get the
gray-filled land, you have to replace a color with gray.
minmax_4.ncl: Shows how to label
the minima and maximia on your plot using
gsn_add_polymarker. The
WhiteBlue
color map has 256 colors, so in order to use red and green markers,
you have to replace the two of the colors using
NhlSetColor. Also, in order to get the
gray-filled land, you have to replace a color with gray.
Example pages containing: tips | resources | functions/procedures
NCL: Local Minima and Maxima
local_min calculates the local minima. It
returns the x and y indices of the minima location, and the minima
values.
 minmax_1.ncl:
Calculates the local minima of some real world psi data and plots
the original data overlaid with white dots that represent the
location of each minima.
minmax_1.ncl:
Calculates the local minima of some real world psi data and plots
the original data overlaid with white dots that represent the
location of each minima.
 minmax_4.ncl: Shows how to label
the minima and maximia on your plot using
gsn_add_polymarker. The
WhiteBlue
color map has 256 colors, so in order to use red and green markers,
you have to replace the two of the colors using
NhlSetColor. Also, in order to get the
gray-filled land, you have to replace a color with gray.
minmax_4.ncl: Shows how to label
the minima and maximia on your plot using
gsn_add_polymarker. The
WhiteBlue
color map has 256 colors, so in order to use red and green markers,
you have to replace the two of the colors using
NhlSetColor. Also, in order to get the
gray-filled land, you have to replace a color with gray.
In order to keep the gray, green, and red from showing up in the color contours, you must set gsnSpreadColorEnd to -4. (-1 represents the last color, so -4 represents the fourth from the last color). Additionally, gsnSpreadColorStart is set to 5 so we are using a symmetrical subset of the color map.
In NCLV6.1.0 and later, named colors do not have to be added to the color map, and hence you won't need to use NhlSetColor or set gsnSpreadColorStart/End.