NCL Home>
Application examples>
Special plots ||
Data files for some examples
Example pages containing:
tips |
resources |
functions/procedures
NCL Graphics: Wind Rose
load "$NCARG_ROOT/lib/ncarg/nclscripts/csm/wind_rose.ncl"
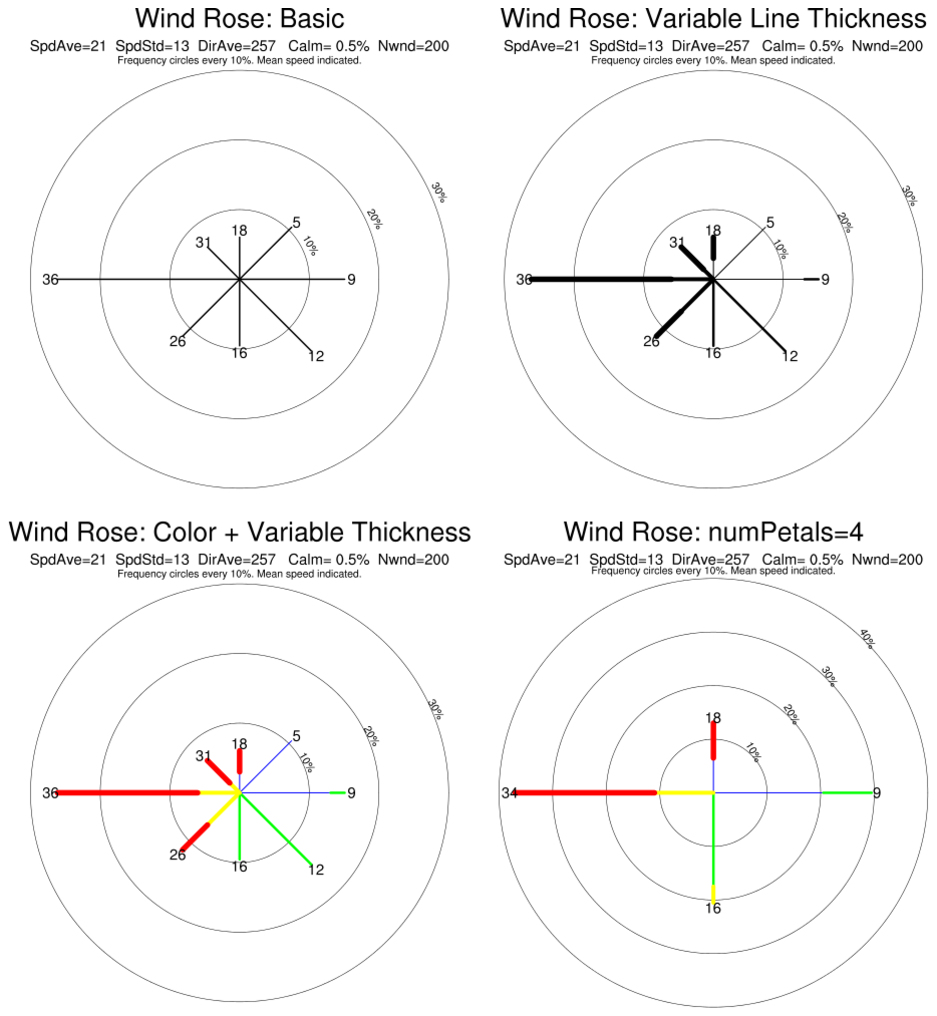
A wind rose displays the frequency (percentage) of wind directions for
a specific location over a specifed period of time. The wind rose
created by NCL's wind rose procedure is circular with each circle
representing the percentage of time the wind blows from a
particular direction. The mean wind speed is printed at the end of
each directional line. FInally, overall statistics for the entire
data sample are included in the title.
NOTE: This is a donated function. Users may have to modify the code
themselves for special effects. The code is not necessarily supported by
the NCL Team. Questions to ncl-talk@ucar.edu may or may not be answered.
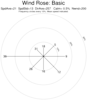 rose_1.ncl
:
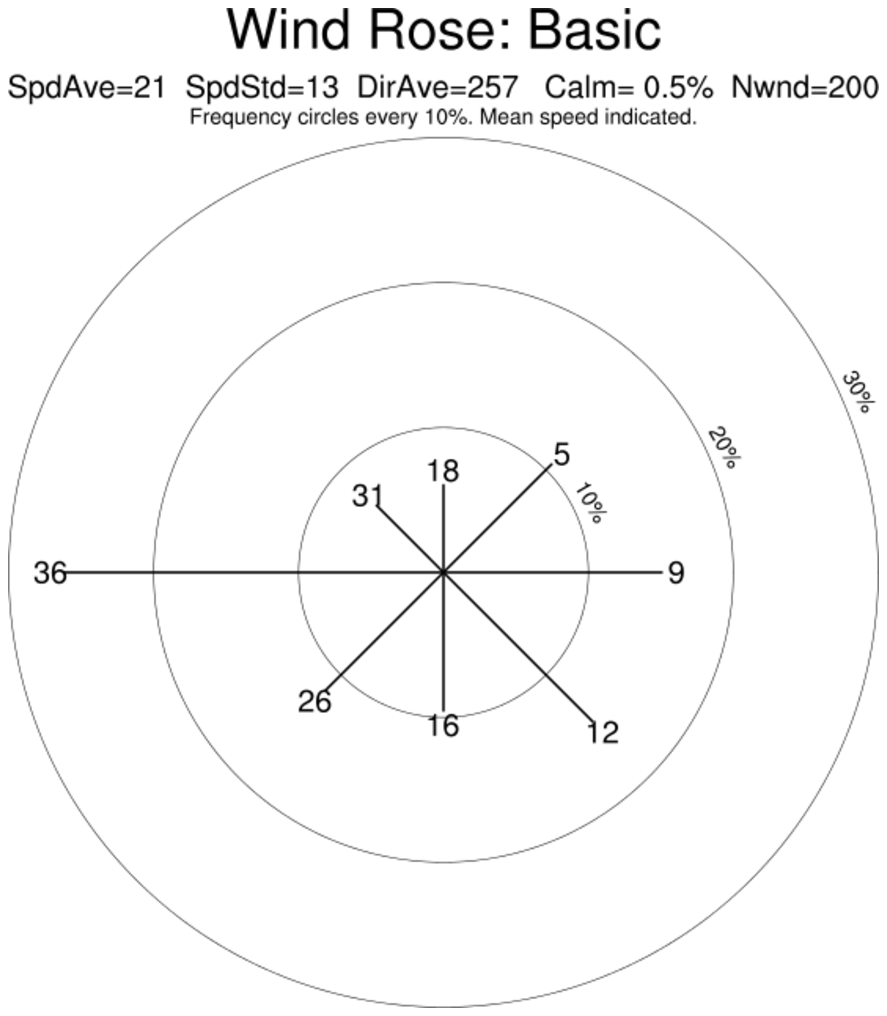
Demonstrates a basic wind rose plot.
The function WindRoseBasic creates
and draws a basic wind rose. There are other functions that make
slightly different plots (see examples below).
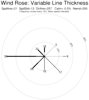 rose_2.ncl
:
Demonstrates a wind rose plot with thicker lines.
The function WindRoseThickLine
creates and draws a wind rose with thicker lines.
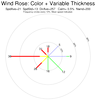 rose_3.ncl
:
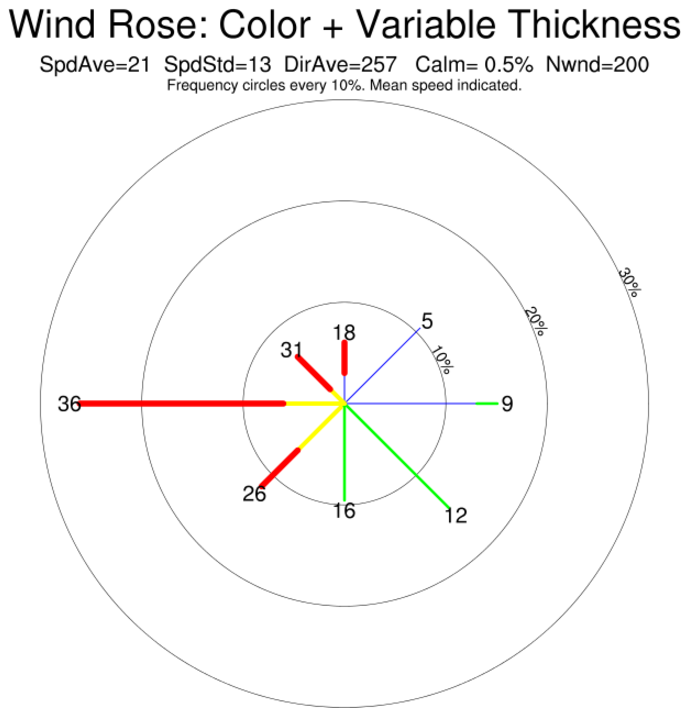
Demonstrates a color wind rose plot with thicker lines.
The function WindRoseColor creates
and draws a color wind rose with thicker lines.
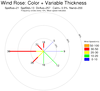 rose_5.ncl
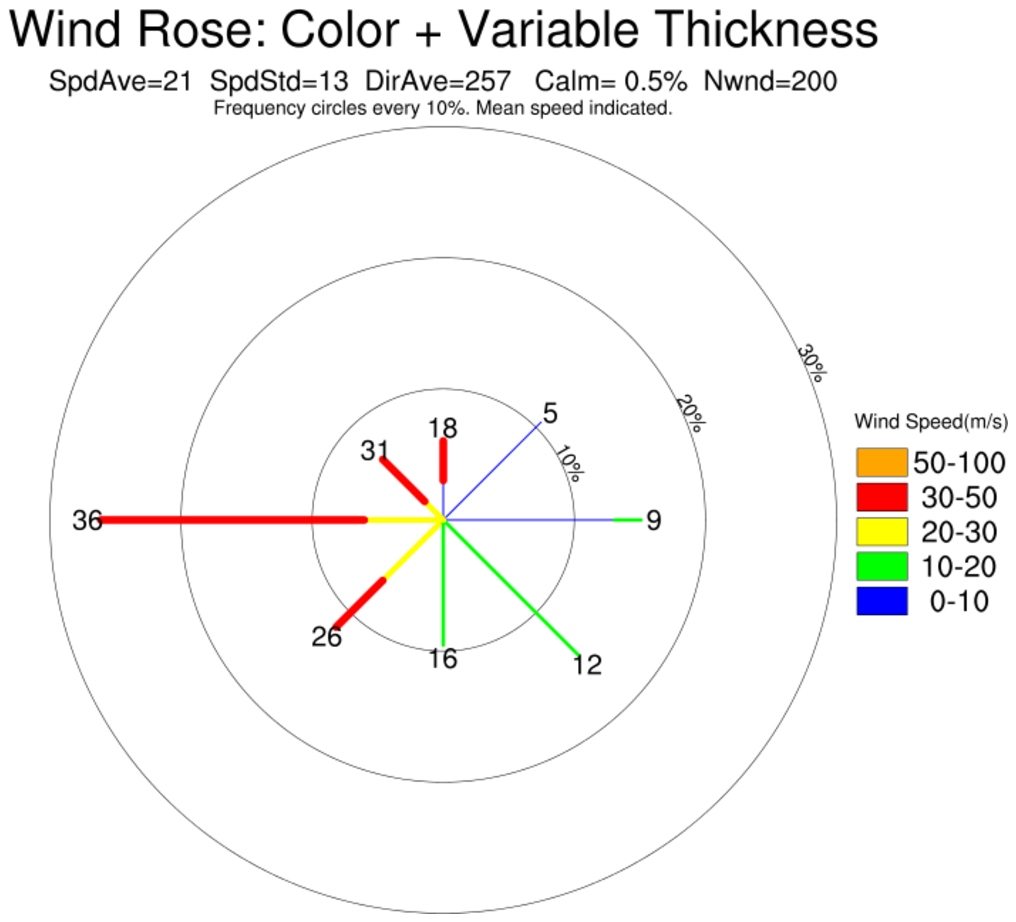
: Add a color label to indicate wind speeds. (
Thanks to Zhiyong Wu, Sun Yat-sen University Guangzhou, China
for contributing the label bar code.)
