One of the keys to plotting these grids correctly on their native map projection, is that you must know the correct center longitude and latitude of the data. This information may appear as metadata in your NetCDF or GRIB file. For example, as attributes called "Longitude_of_southern_pole" and "Latitude_of_southern_pole".
NCL Home>
Application examples>
Maps and map projections ||
Data files for some examples
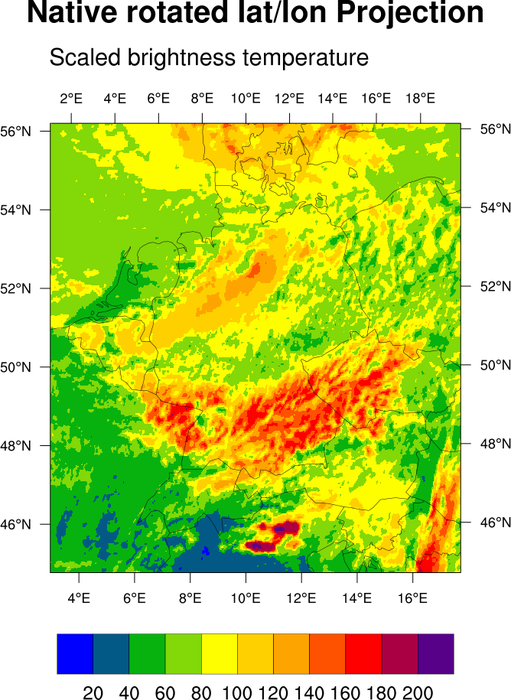
 rotatedltln_1.ncl The first
frame of this example shows how to plot filled contours over a native
rotated lat-lon grid read from a GRIB2 file.
rotatedltln_1.ncl The first
frame of this example shows how to plot filled contours over a native
rotated lat-lon grid read from a GRIB2 file.
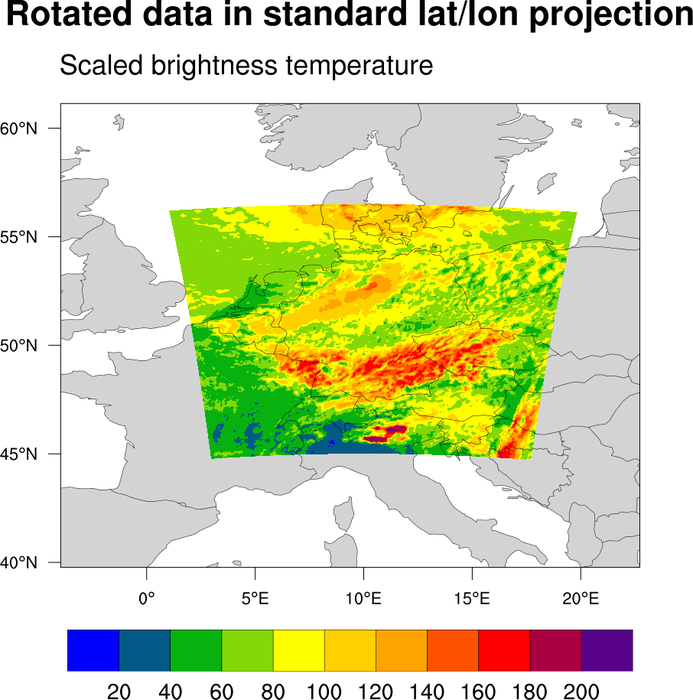
 rotatedltln_2.ncl The map
rotation information is provided on the file as attributes
"grid_north_pole_latitude" and "grid_north_pole_longitude" attached to
a variable called "rotated_pole". To get the center lat/lon rotation
correct in NCL, the formula for this grid is:
rotatedltln_2.ncl The map
rotation information is provided on the file as attributes
"grid_north_pole_latitude" and "grid_north_pole_longitude" attached to
a variable called "rotated_pole". To get the center lat/lon rotation
correct in NCL, the formula for this grid is:
Example pages containing: tips | resources | functions/procedures
NCL Graphics: Rotated lat-lon projections
This page shows how to plot data on a rotated lat-lon grid, which is a
grid with the poles shifted.
 rotatedltln_1.ncl The first
frame of this example shows how to plot filled contours over a native
rotated lat-lon grid read from a GRIB2 file.
rotatedltln_1.ncl The first
frame of this example shows how to plot filled contours over a native
rotated lat-lon grid read from a GRIB2 file.
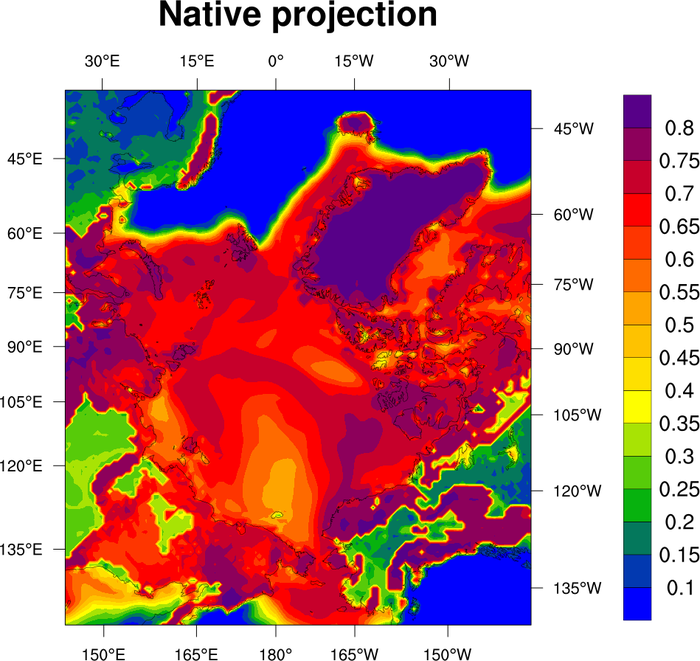
The map projection information is provided on the file as attributes of the "gridlat_0" and "gridlon_0" variables on the file. This information is used to set the necessary map resources for plotting the data natively.
Additionally, the tfDoNDCOverlay resource is set to True to tell NCL we are plotting the data natively. No data transformation will take place.
The second frame of this example shows how to plot the same data on another projection, this time using the lat/lon values provided on the file. In this case, tfDoNDCOverlay resource is set to False, and the resources sfXArray and sfYArray are set to the longitude and latitude values on the file, respectively.
 rotatedltln_2.ncl The map
rotation information is provided on the file as attributes
"grid_north_pole_latitude" and "grid_north_pole_longitude" attached to
a variable called "rotated_pole". To get the center lat/lon rotation
correct in NCL, the formula for this grid is:
rotatedltln_2.ncl The map
rotation information is provided on the file as attributes
"grid_north_pole_latitude" and "grid_north_pole_longitude" attached to
a variable called "rotated_pole". To get the center lat/lon rotation
correct in NCL, the formula for this grid is:
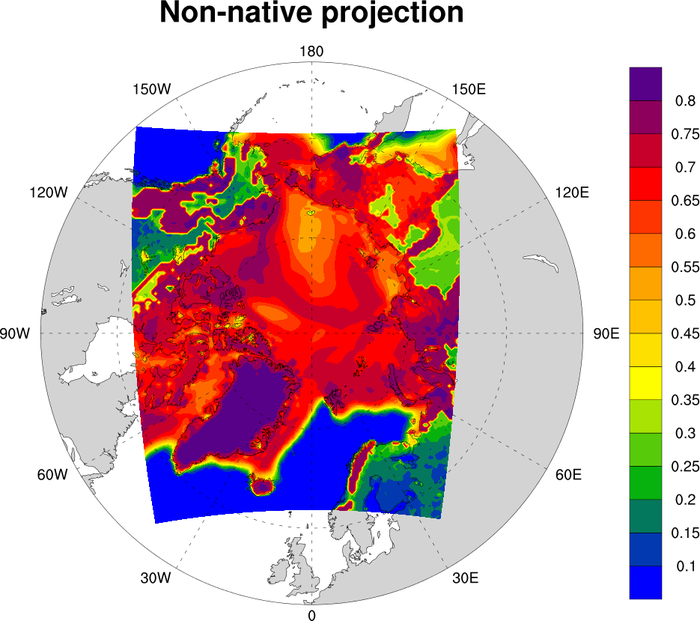
  res@mpCenterLatF = 90 - rotated_pole@grid_north_pole_latitude
  res@mpCenterLonF = 180 + rotated_pole@grid_north_pole_longitude
As with the above example, the tfDoNDCOverlay resource is set to True to tell NCL we are plotting the data natively. No data transformation will take place.
The second frame shows how to plot the data using the 2D lat/lon coordinates provided on the file. This data is plotted over a polar stereographic projection over the north pole.
The "albedo" data files were provided by Wenxin Zhang (Lund University, Sweden).