NCL version 5.1.0 is required to use the wkSpaceTime and wkSpaceTime_cam interfaces.
The scripts below are intended to be 'guide' to usage. They may work directly but, generally, the user will have to make some changes to the scripts.
The scripts are expecting data to be periodic (cyclic) in the longitude direction. The latitude extent must include latitudes about the equator. Further, the latitude and longitude coordinate arrays must consist of one dimensional monotonically {in/de}creasing values.
The following four libraries must be loaded prior to use.
load "$NCARG_ROOT/lib/ncarg/nclscripts/csm/gsn_code.ncl"
load "$NCARG_ROOT/lib/ncarg/nclscripts/csm/gsn_csm.ncl"
load "$NCARG_ROOT/lib/ncarg/nclscripts/csm/contributed.ncl"
load "$NCARG_ROOT/lib/ncarg/nclscripts/csm/diagnostics_cam.ncl"
********************* REFERENCES *********************
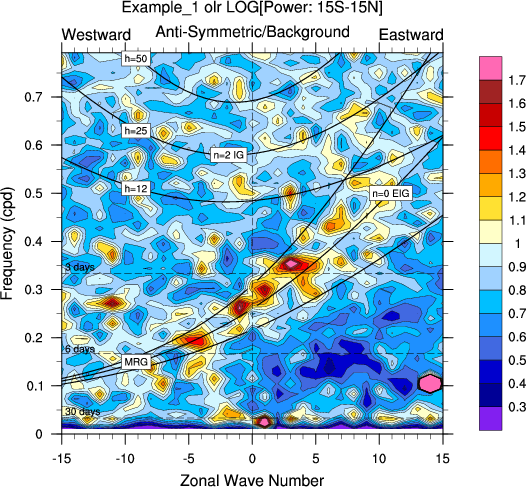
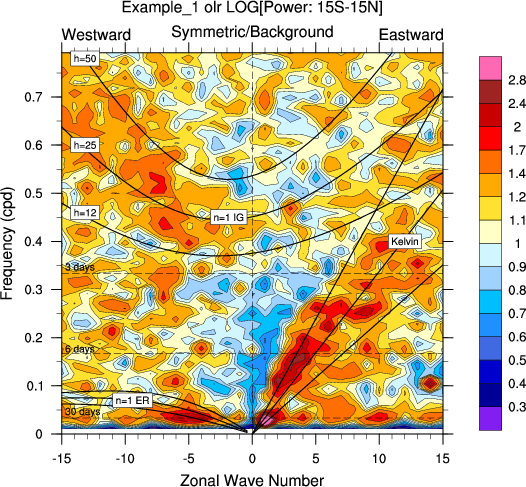
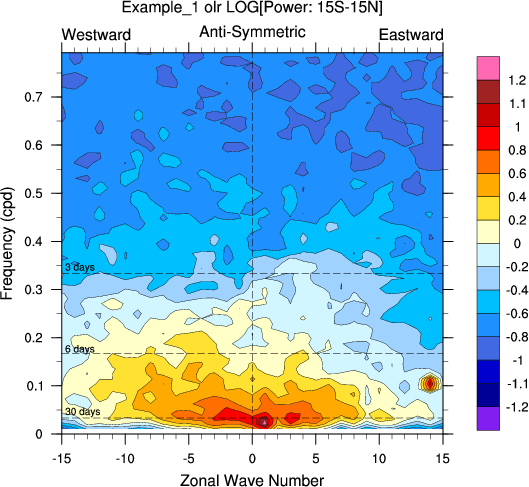
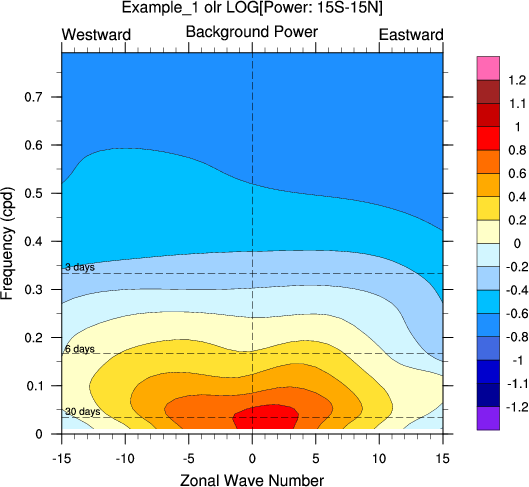
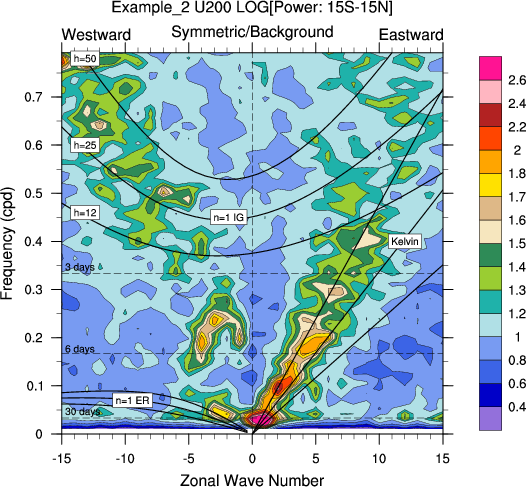
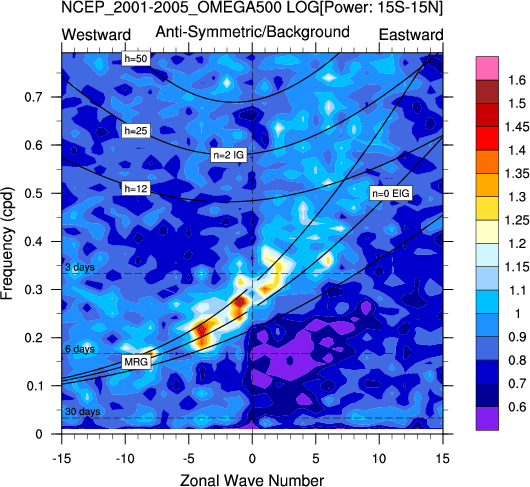
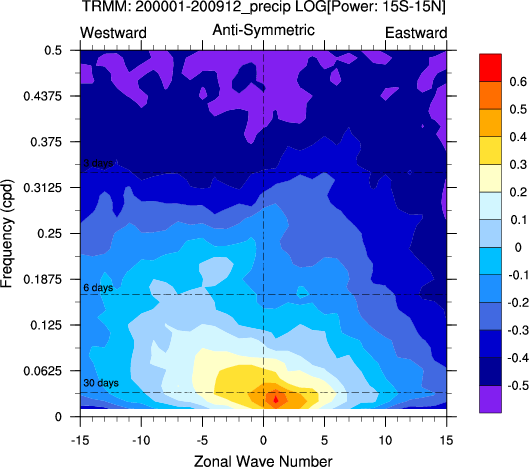
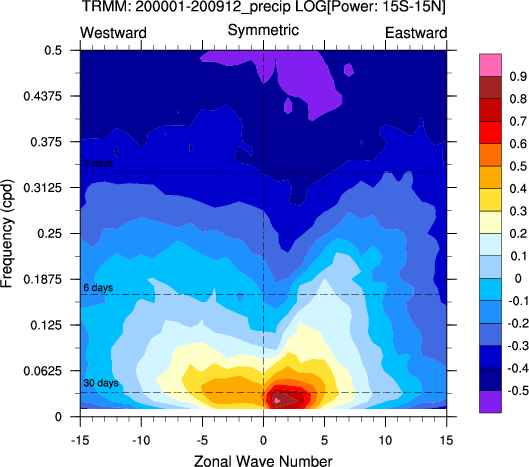
Wheeler, M., G.N. Kiladis
Convectively Coupled Equatorial Waves:
Analysis of Clouds and Temperature in the
Wavenumber-Frequency Domain
J. Atmos. Sci., 1999, 56: 374-399.
----
Hendon, H.H., and M.C. Wheeler
Some space-time spectral analyses
of tropical convection and planetary-scale waves.
J. Atmos. Sci., 2008, 65: 2936-2948.
----
Hayashi, Y.
A Generalized Method of Resolving Disturbances into
Progressive and Retrogressive Waves by Space and
Fourier and TimeCross Spectral Analysis
J. Meteor. Soc. Japan, 1971, 49: 125-128.
************ Space-Time Monitoring ****************
Matt Wheeler (CAWCR: The Centre for Australian Weather and Climate Research)
has a
WWW link
devoted to "real-time filtering of OLR data to monitor and predict the
convective variations of the Madden-Julian oscillation and
various convectively coupled equatorial waves."

