Example pages containing: tips | resources | functions/procedures
NCL Graphics: Titles
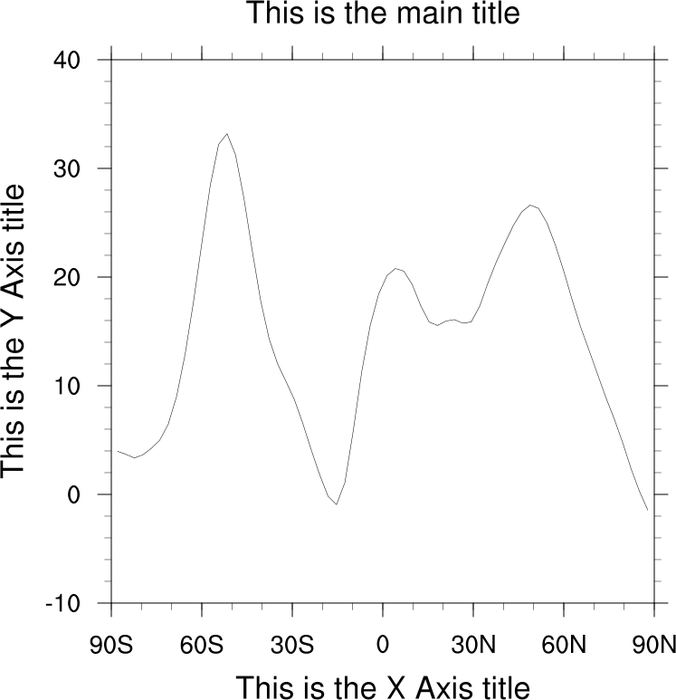
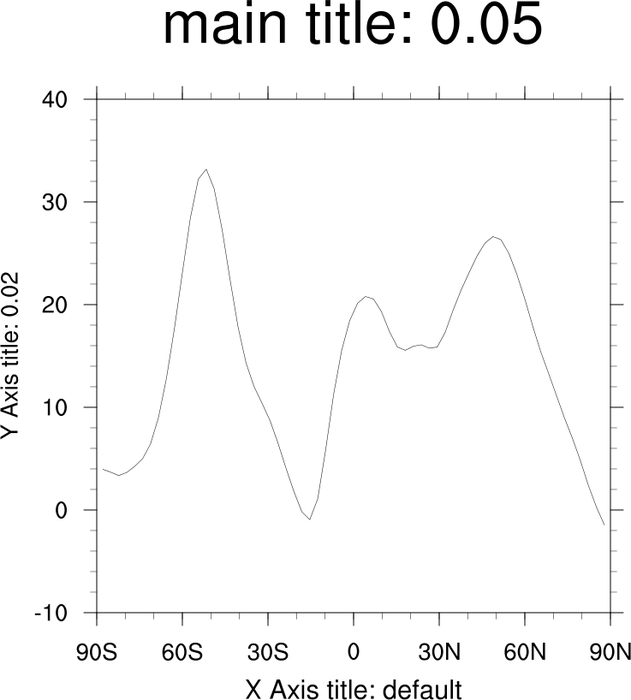
 title_1.ncl: Demonstrates the three
main titles.
title_1.ncl: Demonstrates the three
main titles.
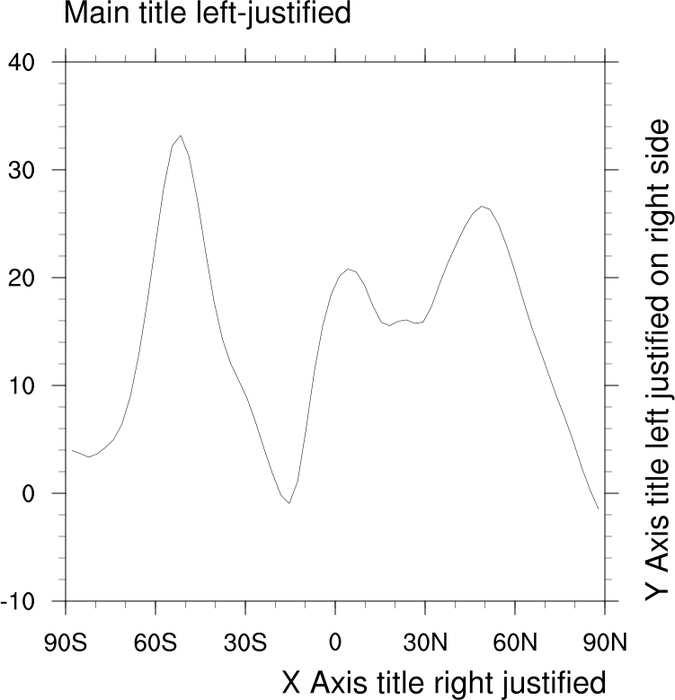
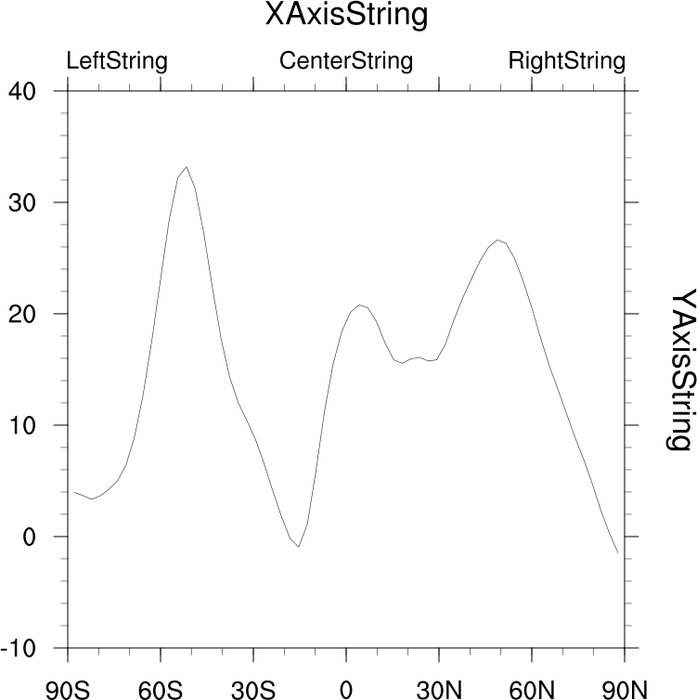
tiMainString adds the main title while tiXAxisString and tiYAxisString add the axis titles.
The following resources allow you to contol the position of the title relative to its axis: tiMainJust tiMainPosition tiXAxisJust tiXAxisPosition = "Right" tiYAxisJust = "CenterLeft" tiYAxisSide = "Right" tiYAxisPosition = "Bottom"
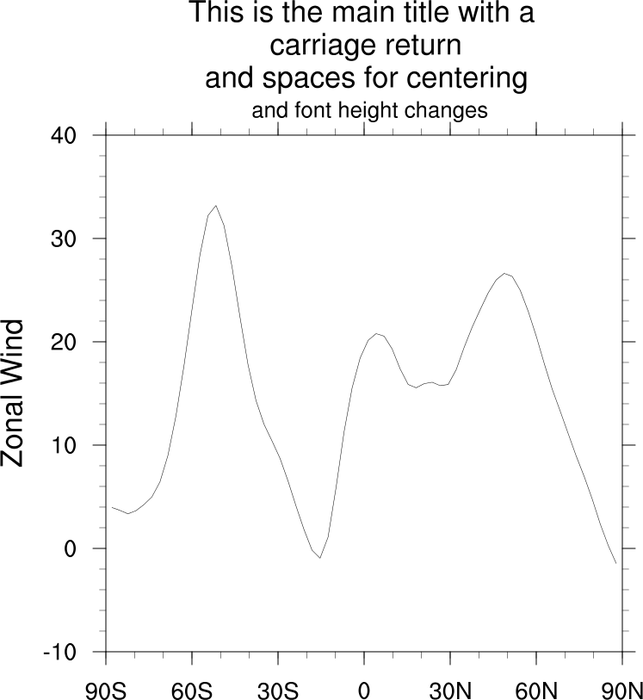 title_2.ncl: Demonstrates how you can
add a carriage return to the main title and shrink the text in mid
stream to give the illusion of multiple titles.
title_2.ncl: Demonstrates how you can
add a carriage return to the main title and shrink the text in mid
stream to give the illusion of multiple titles.
The ~C~ will put a carriage return in a text string. By default it is left justified. If you need it centered, you will have to add spaces.
Use a ~Z#~ to resize text in mid-stream. The # refers to the percent of normal.
The ~ character has a special meaning in NCL strings. It represents a function code. See the function codes example page for more examples of function codes.
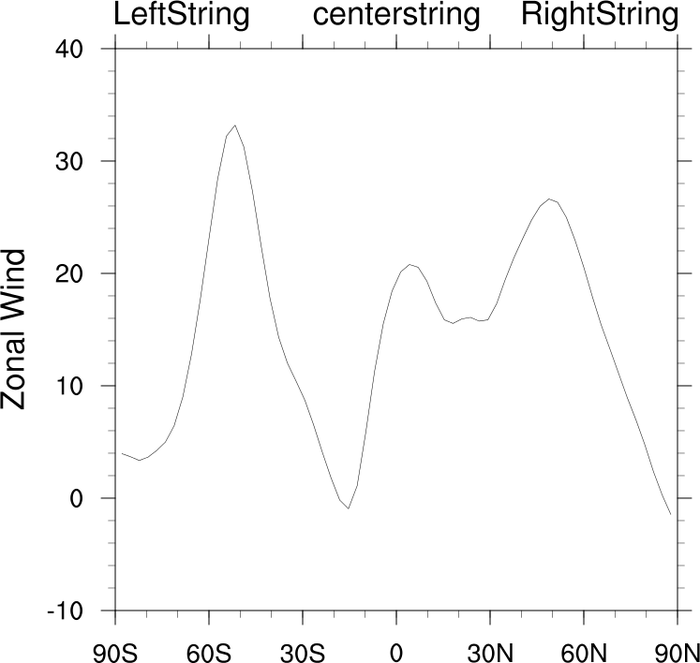
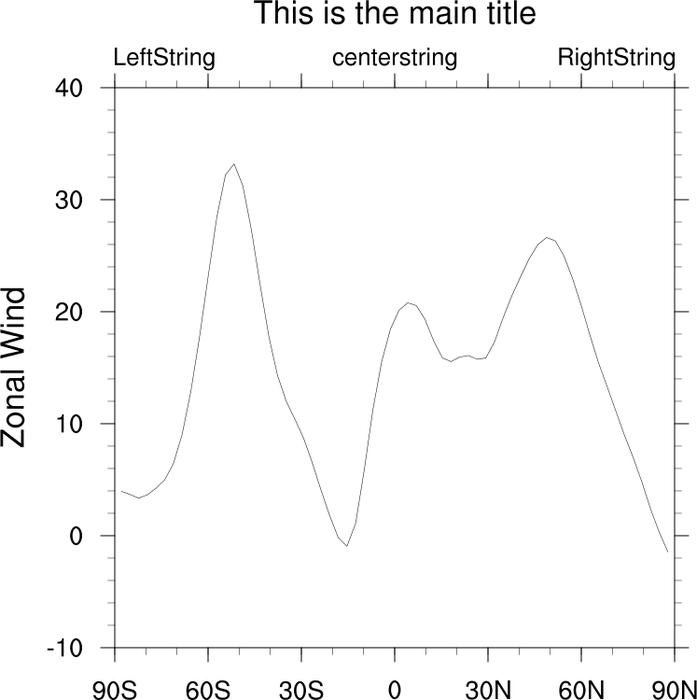 title_3.ncl: Demonstrates how
to set the special gsn strings.
title_3.ncl: Demonstrates how
to set the special gsn strings.
There are three special gsn strings, gsnLeftString, gsnCenterString, and gsnRightString.
If your data has a long_name and units attribute, they will be placed in the gsnLeftString and gsnRightString respectively. You can turn these automatic labels off by setting the string resource to a null string " ".
 title_4.ncl: Demonstrates changing
the font heights of the main three titles.
title_4.ncl: Demonstrates changing
the font heights of the main three titles.
You can not change all the font heights with one resource. Each title is controlled separately by:
tiMainFontHeightF, tiXAxisFontHeightF, and tiYAxisFontHeightF.
 title_5.ncl: Demonstrates changing
the font heights of the three special gsn strings.
title_5.ncl: Demonstrates changing
the font heights of the three special gsn strings.
The special gsn strings are added in the plot templates. They are not official titles, and therefore their font heights are not controlled by title (ti) resources, but rather by the gsn resource gsnStringFontHeightF. txFontHeightF can also be used to set the three gsn string font heights. Note that either of these two resources affects all of the strings equally. You can also set the font height of each of the three strings seperately, see Example 6 below.
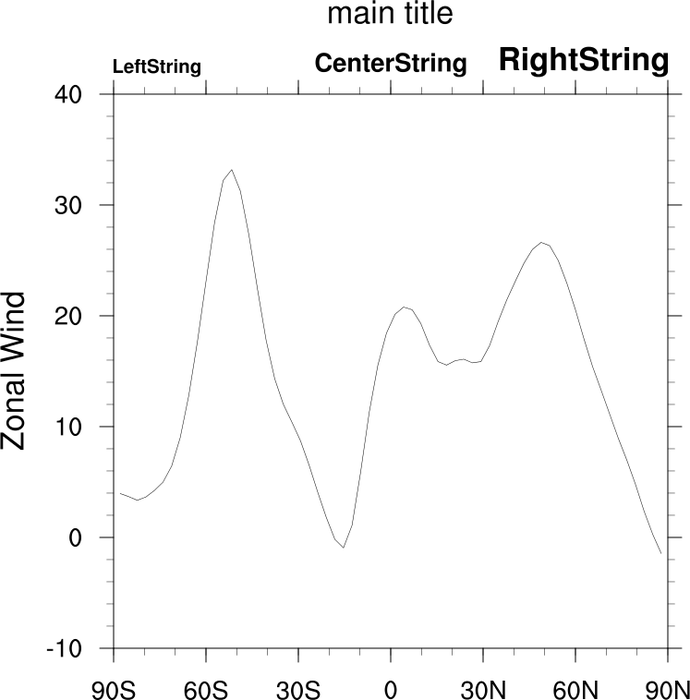 title_6.ncl: Demonstrates how to set the font heights of
gsnLeftString,
gsnCenterString, and
gsnRightString seperately.
title_6.ncl: Demonstrates how to set the font heights of
gsnLeftString,
gsnCenterString, and
gsnRightString seperately.
This script also shows how to change the font type of tiMainString and the three gsn strings. By default, tiMainString is drawn in bold and the three gsn strings are not.
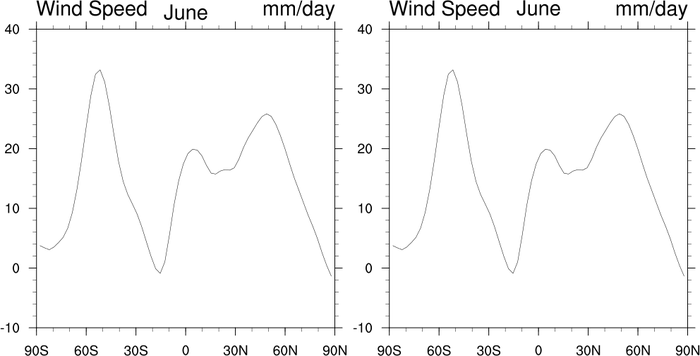 title_7.ncl: Demonstrates how to alter the locations of
the three special gsn strings. The top panel plot shows the three gsn titles in their default locations.
For the bottom panel:
gsnLeftStringParallelPosF
is used to move the gsnLeftString slightly
left, gsnCenterStringOrthogonalPosF
is used to move the gsnCenterString up, and
gsnRightStringParallelPosF is used to
move the gsnRightString slightly right. Note that
both Parallel and Orthogonal resources exist for all three gsn strings.
title_7.ncl: Demonstrates how to alter the locations of
the three special gsn strings. The top panel plot shows the three gsn titles in their default locations.
For the bottom panel:
gsnLeftStringParallelPosF
is used to move the gsnLeftString slightly
left, gsnCenterStringOrthogonalPosF
is used to move the gsnCenterString up, and
gsnRightStringParallelPosF is used to
move the gsnRightString slightly right. Note that
both Parallel and Orthogonal resources exist for all three gsn strings.
By setting gsnCenterStringOrthogonalPosF, the gsnCenterString can be brought up to the same vertical plane as the gsnLeftString and gsnRightString.
As to why the gsn strings are not by default on the same vertical plane, NCL draws the gsn strings along a baseline that is set at the absolute bottom of the text strings. When the characters q, g, y, p, or j are part of the text string (as is the case here for the Left and Right Strings), the baseline is set at the bottom of those letters, slightly raising the text strings in the vertical.
 title_8.ncl: Demonstrates how to move the
tiXAxisString to the top of the plot by using
tiXAxisSide,
and how to move the tiYAxisString
to the right of the plot by using tiYAxisSide.
tiYAxisAngleF is also used to alter the
angle of the Y-axis.
title_8.ncl: Demonstrates how to move the
tiXAxisString to the top of the plot by using
tiXAxisSide,
and how to move the tiYAxisString
to the right of the plot by using tiYAxisSide.
tiYAxisAngleF is also used to alter the
angle of the Y-axis.
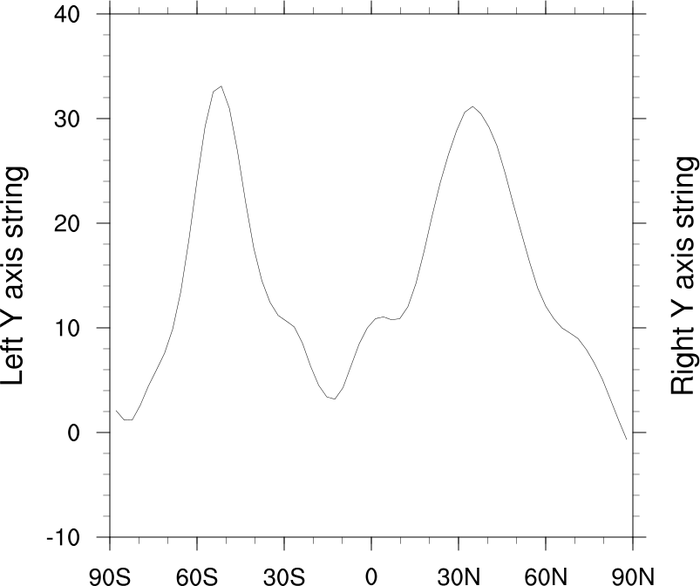 text_11.ncl: This example shows how
to use gsn_add_text to add a string
on the right Y axis, since you can't have both a right and left Y axis
string using the usual ti* resources.
text_11.ncl: This example shows how
to use gsn_add_text to add a string
on the right Y axis, since you can't have both a right and left Y axis
string using the usual ti* resources.
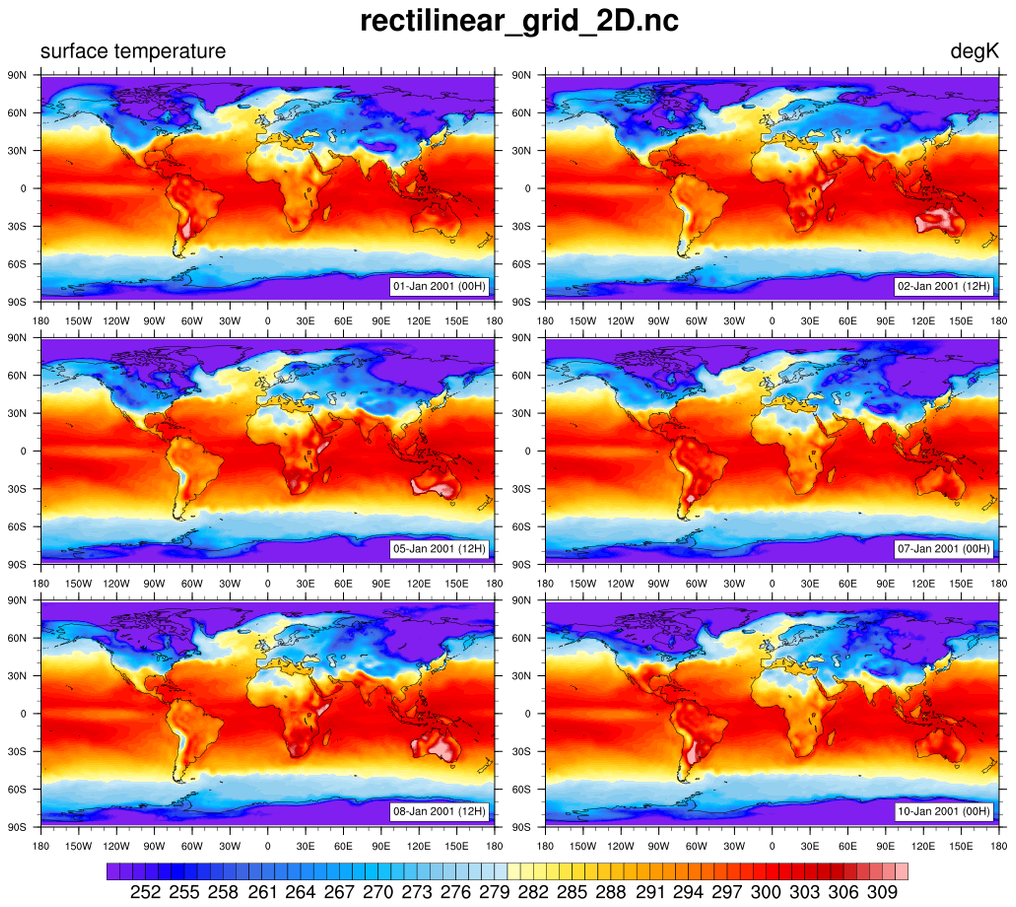 panel_41.ncl: This example shows
how to add left, right, and center subtitles to a series of paneled
plots, in the same style that is done for individual plots that
use gsnLeftString,
gsnCenterString,
and gsnRightString. See the
"draw_panel_titles" procedure in this script.
panel_41.ncl: This example shows
how to add left, right, and center subtitles to a series of paneled
plots, in the same style that is done for individual plots that
use gsnLeftString,
gsnCenterString,
and gsnRightString. See the
"draw_panel_titles" procedure in this script.
The unadvertised gsnPanelSave resource is set to True, which tells gsn_panel to keep the plots in their resized state. This allows us to query for the NDC locations of the topmost paneled plots, and then use this information to draw the titles just above the plots using gsn_text_ndc.