NCL Home>
Application examples>
Plot techniques ||
Data files for some examples
Example pages containing:
tips |
resources |
functions/procedures
NCL Graphics: Viewport - positioning and sizing graphical objects
The
viewport of a plot or
drawable object (like a labelbar) is a rectangular subregion
of
NDC space that specifies where the
object will be placed when drawn. You can use the special
resources
vpXF,
vpYF,
vpWidthF,
and
vpHeightF to reposition and resize
the plots.
The precise meaning of the viewport depends on the object. For
example, for XY plots, the viewport specifies where the grid
containing the curves will be placed. The labeling, if any, will
be drawn outside of the viewport.
For text strings, the viewport is simply a rectangle surrounding the
text string.
A bounding box is
the smallest rectangle in NDC space that contains all of a particular
object's attributes.
For example, for an XY plot, this would include the area containing
the tickmarks, tickmark labels, the main title, X/Y axis titles,
legend, and anything else associated with the XY plot.
For a text string, the bounding box is the same as the viewport.
The examples below compare the viewports and bounding boxes for
various graphical objects. They also show how to position and resize
objects. For more information on resizing plots, see the Resizing page.
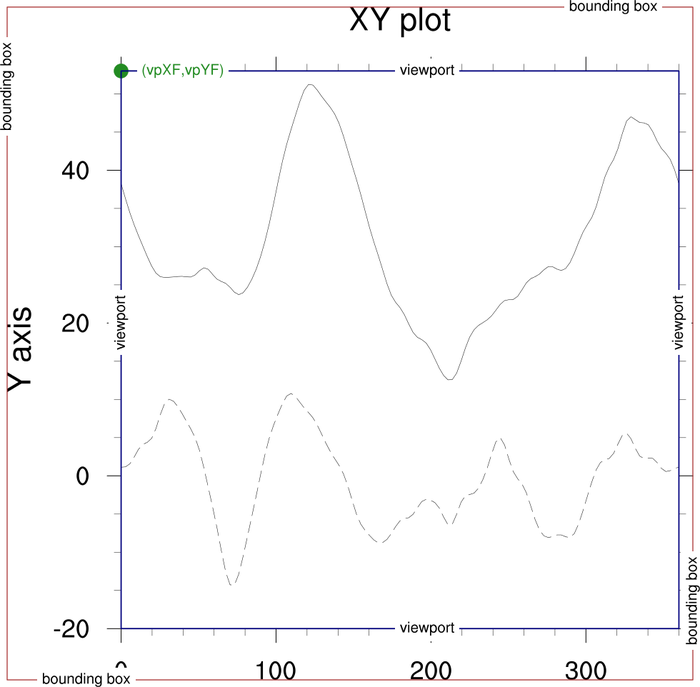
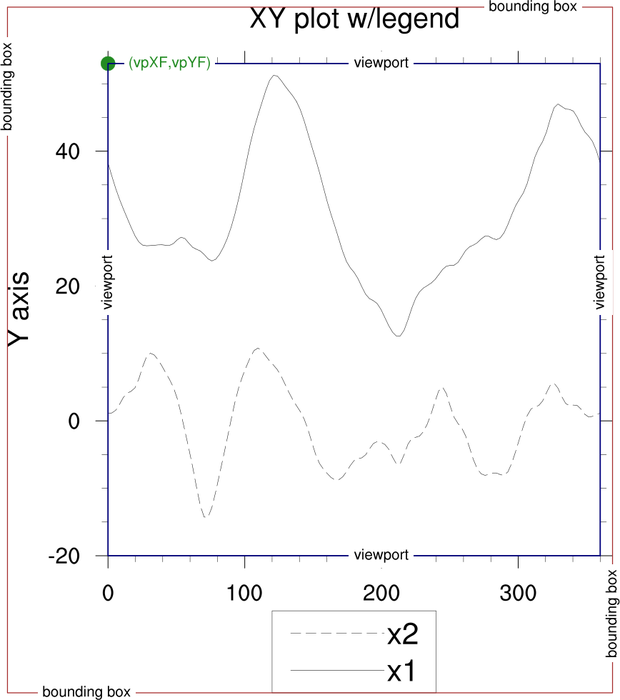
 viewport_1.ncl
: This
example draws an XY plot with its viewport and bounding box
outlined in the second and third frames.
The green dot shows the location represented by vpXF and vpYF,
which is always the upper left corner of a graphical object.
The width and height of the viewport are represented by the resources
vpWidthF
and vpHeightF. These values are
in NDC space.
The viewport values are retrieved using getvalues.
The bounding box is retrieved using the NhlGetBB
function.

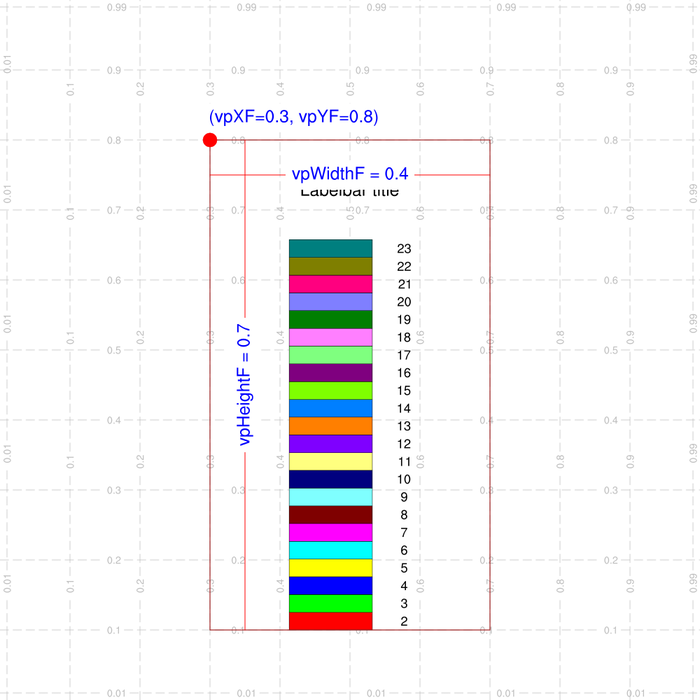
 viewport_2.ncl
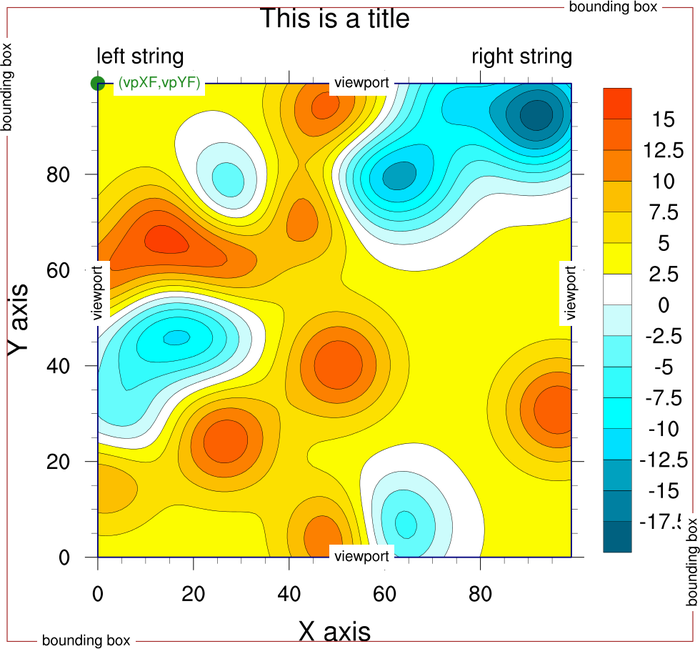
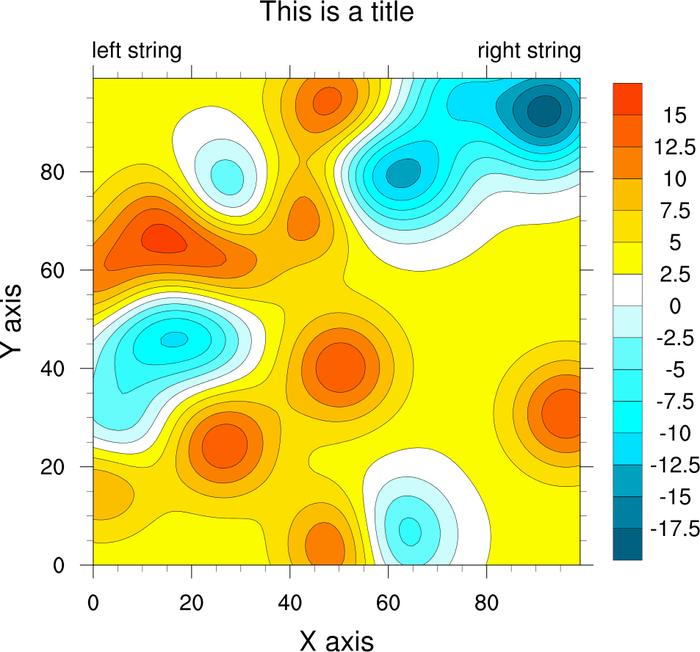
: This
example draws a contour plot with a vertical labelbar.
The viewport and bounding box are outlined in the second frame.
 viewport_4.ncl
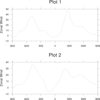
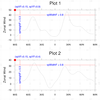
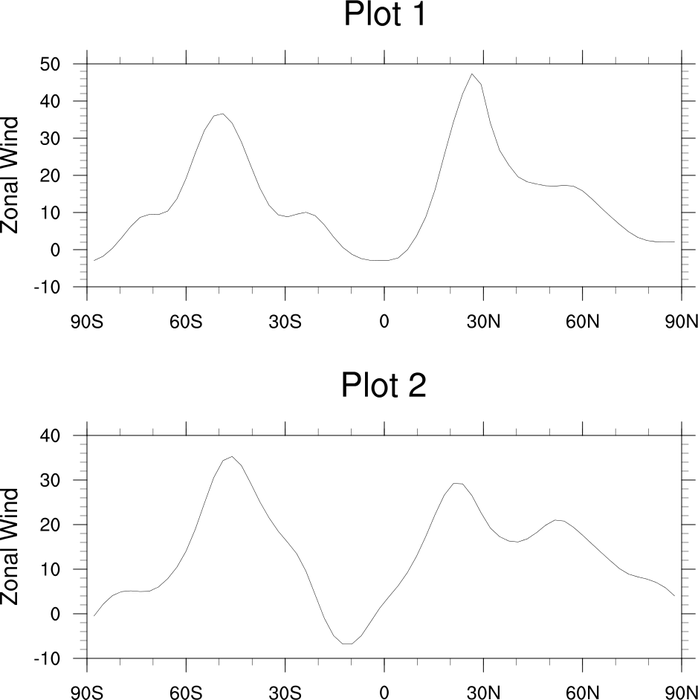
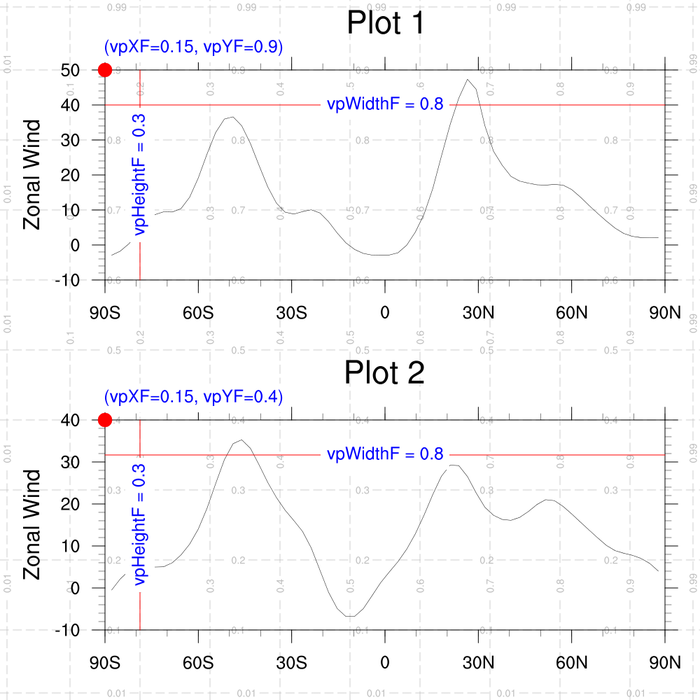
: This
example draws two XY plots on the same page using
viewport resources
vpXF,
vpYF,
vpWidthF,
and
vpHeightF to position
and resize the plots.
The second frame shows the use
of drawNDCGrid, which draws a
labeled NDC grid. This is useful for
placing further text, polymarkers, polygons, and/or polylines in NDC
coordinates near the plot.

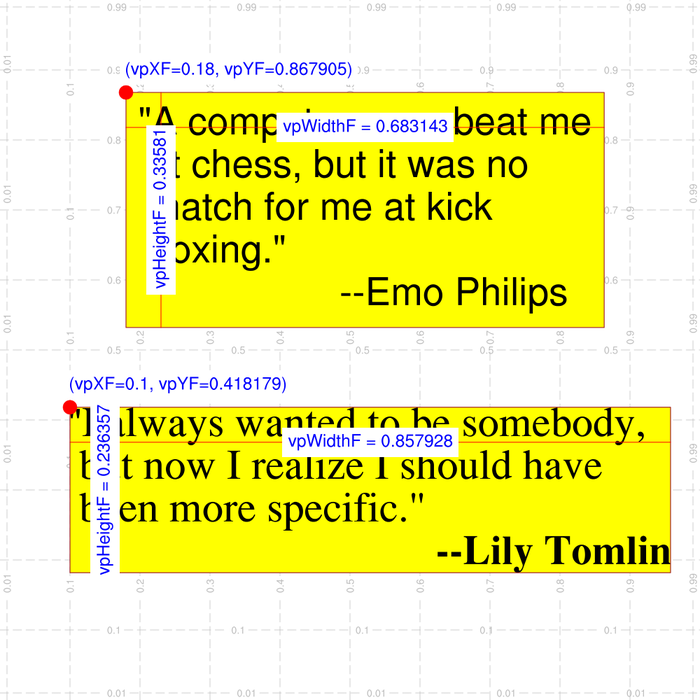
 viewport_5.ncl
: This
example draws a labelbar on one frame, and some text strings on
another, with illustrations showing the bounding box and viewport.
Note the labelbar has quite a bit of white space around it. This is
due to a rather complicated algorithm that is used to determine how to
create the labelbar and allow enough space so it doesn't overlap with
a plot. See this posting on ncl-talk "Label
bar position" for more details.
The top text string in the second frame has white
space around it. You can turn this off by setting
res@txPerimSpaceF = 0.
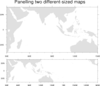
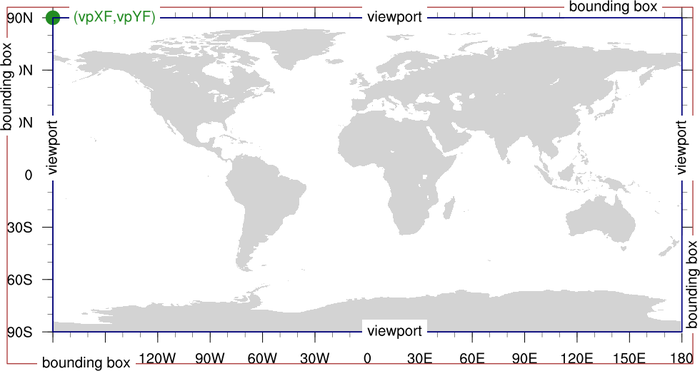
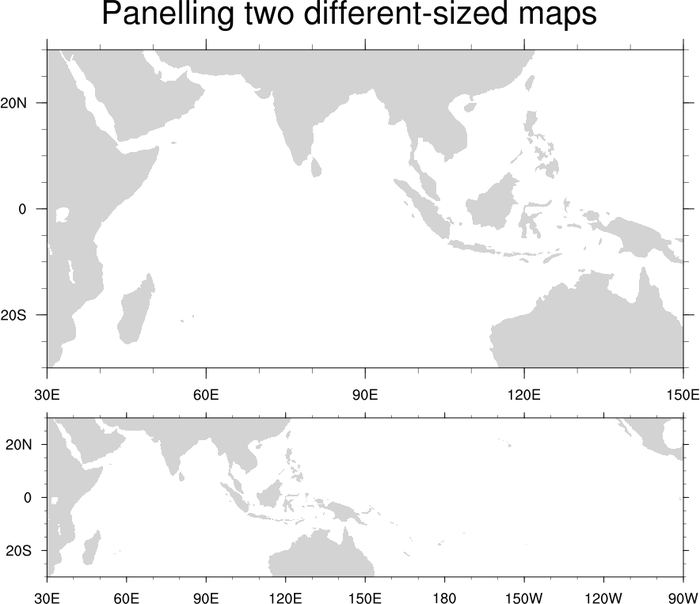
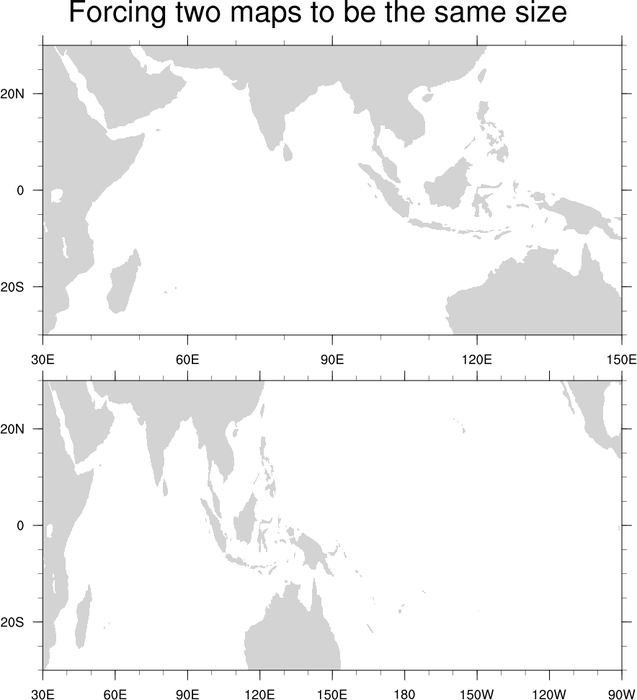
 viewport_6.ncl
: By default, you
can't change the width and height of a map. This example shows how to
force a map to be a different width and height by further setting
the
mpShapeMode resource to
"FreeAspect". This will skew your map, so be careful with this
resource.


