NCL Home>
Application examples>
Models ||
Data files for some examples
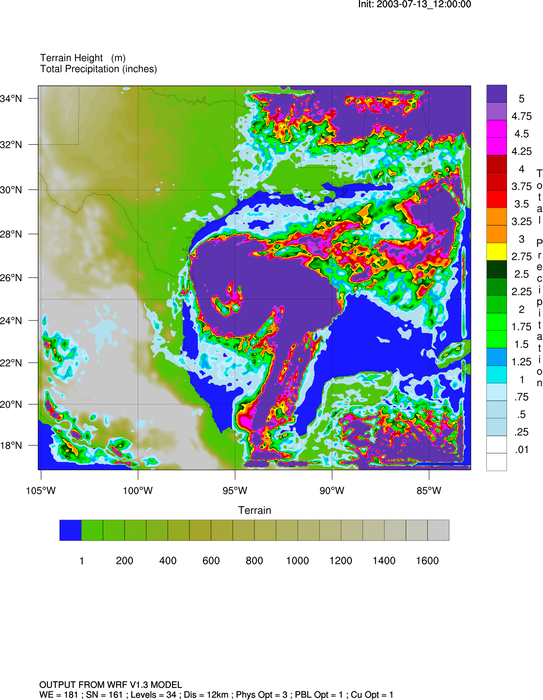
 WRF_pcp_1.ncl: This example shows
how to overlay precipitation contours on a terrain map, each with its
own color map. For the two lowest precipitation contours, the colors
are set to transparent. Since two color maps are used here, one of
the labelbars is drawn horizontally, and the other vertically.
WRF_pcp_1.ncl: This example shows
how to overlay precipitation contours on a terrain map, each with its
own color map. For the two lowest precipitation contours, the colors
are set to transparent. Since two color maps are used here, one of
the labelbars is drawn horizontally, and the other vertically.
 WRF_pcp_2.ncl: This example shows
how to overlay precipitation contours on a grayscale terrain map, using
transparency to control the colors for precipitation.
WRF_pcp_2.ncl: This example shows
how to overlay precipitation contours on a grayscale terrain map, using
transparency to control the colors for precipitation.
Example pages containing:
tips |
resources |
functions/procedures
NCL Graphics: WRF Precipitation
For a whole suite of examples using NCL to plot WRF-ARW data, we
recommend that you visit the WRF-ARW
Online Tutorial.
WRF_pcp_1.ncl: This example shows
how to overlay precipitation contours on a terrain map, each with its
own color map. For the two lowest precipitation contours, the colors
are set to transparent. Since two color maps are used here, one of
the labelbars is drawn horizontally, and the other vertically.
wrf_contour and wrf_map_overlays are used to create the plots. Using these functions allows you to take advantage of the metadata on the WRF file for special titles.
There's a version of this script that uses gsn_csm_xxx functions to do the plotting on the contour-on-contour page.
Thanks to Dr. Craig Mattocks at the Center for Environmental Modeling for Policy Development, UNC-Chapel Hill, for providing the inspiration for this example and helping fine-tune it.
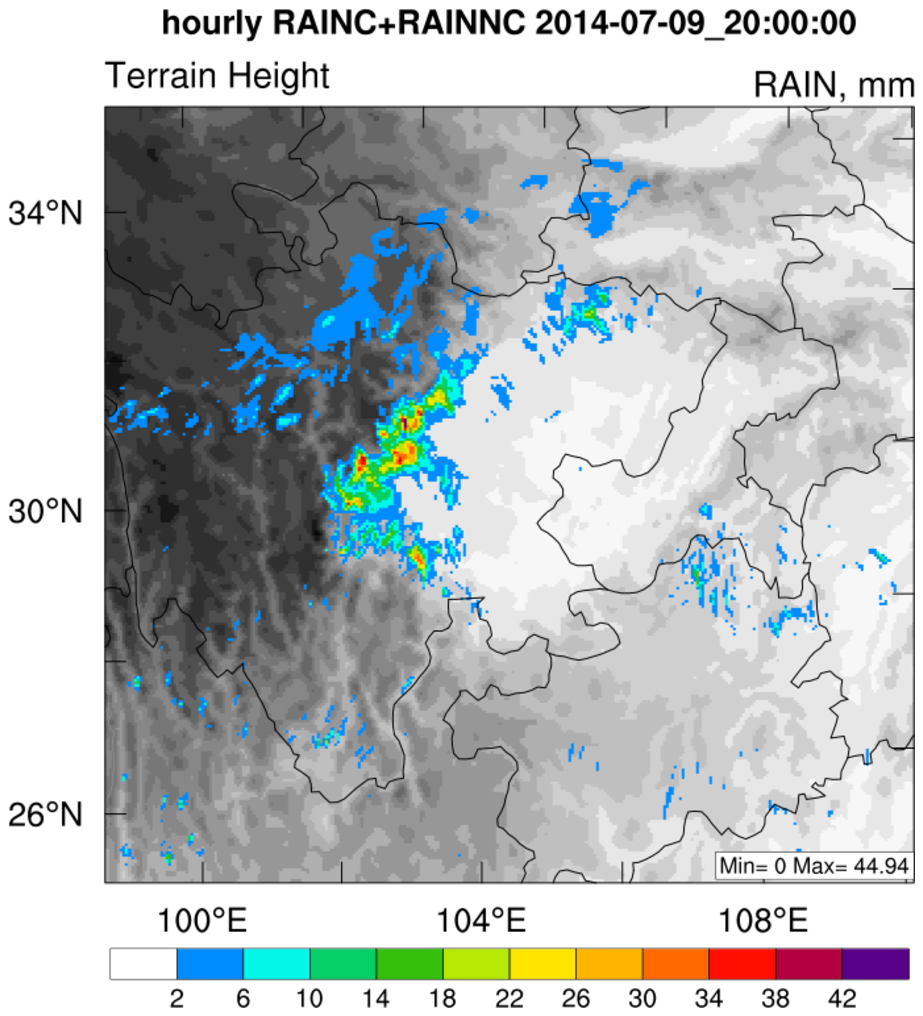 WRF_pcp_2.ncl: This example shows
how to overlay precipitation contours on a grayscale terrain map, using
transparency to control the colors for precipitation.
WRF_pcp_2.ncl: This example shows
how to overlay precipitation contours on a grayscale terrain map, using
transparency to control the colors for precipitation.
gsn_csm_contour_map is used to create the base terrain plot, and gsn_csm_contour is used for the precipitation plot. wrf_map_resources is used to get the correct map projection parameters as defined on the WRF file.
This script was contributed by Xiao-Ming Hu (xhu@ou.edu) at the Center for Analysis and Prediction of Storms, University of Oklahoma.