This page documents the various resources you can set to
add, customize, or remove titles associated with
WRF plotting functions.
Here are the title attributes recognized by
wrf_contour and
wrf_vector:
- MainTitle - Sets a main title at the top left corner of the
page that is 1.5 times larger than the other titles.
Default = " "
- MainTitlePos - Indicates the position of the main title.
Default = "Left" ("Left" / "Center" / "Right")
- InitTime - If True, will put the model start time at the
top right of your page using the START_DATE or SIMULATION_START_DATE
global attribute on the file.
Default = True
- ValidTime - If True, will look for a TimeLabel
attribute set by the user, and will use this as an additional
title to appear under the "Init: " label at the top of the page.
Default = True
- TimeLabel - see ValidTime
No default is provided.
- TimePos - Indicates whether to right or left justify
the InitTime and ValidTime labels.
Default = "right" ("right" / "left")
- Footer - Indicates whether to add a footer title at the
bottom lower left of the page.
The footer will include two lines of text including the TITLE global
attribute, the distance in kilometers, the spatial and level
dimension sizes, and various physics parameters that were used to
create the WRF output file.
Default = True
- FieldTitle - By default, a field title will be added to the
upper left area just above the plot for each contour and/or vector
plot that is overlaid. You can set this resource for any of the
overlay plots if you want to change this title.
This string will also be used as part of the
cnInfoLabel string or labelbar title
(lbTitleString).
The default is the variable's "description" and "units" attributes.
- UnitLabel - This string will be appended
after FieldTitle, in parentheses.
The default is the variable's "units" attribute, if any.
- SubFieldTitle - This string will be appended after
the FieldTitle, before UnitLabel.
There is no default.
- PlotLevelID (default is " at " opts@PlotLevelId)
- NoHeaderFooter - If True, all of the titles at the top
right and lower left of the page and the main title at the upper left
will be turned off. This will not affect the field title(s) just above the
plot. See NoTitles below.
This is useful if you need to panel plots later using
gsn_panel.
Default = True
- FontHeightF - This sets the base font height for all titles.
The MainTitle will be 1.5 times the base font height.
Default = 0.01
wrf_map_overlays
adds left-justified titles just above the plot for every
plot that is overlaid.
Here are the resources that allow you to customize these titles:
- CommonTitle - If True, allows you to replace the
left-justified field title(s) with your own title via PlotTitle.
Default = False
- PlotTitle - see CommonTitle
- NoTitles - If True, removes the left-justified field title(s) just
above the plot.
Default = False
If you want far more customization of titles in your plot, then you
may want to consider using the gsn_csm
functions for plotting WRF data.
For a more complete suite of examples using NCL to plot WRF-ARW data,
we recommend that you visit
the WRF-ARW
Online Tutorial.
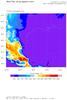
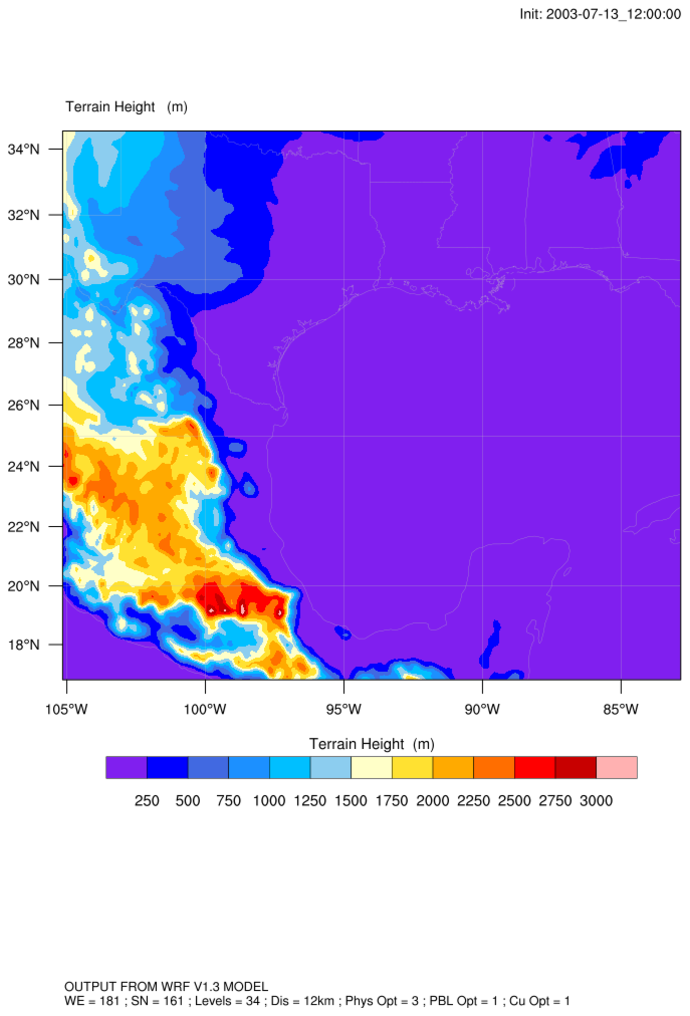
 wrf_title_1.ncl
:
This is a simple filled contour plot of the HGT variable
read off a WRF output file.
The title at the top right of the page is from the global attribute
"START_DATE" or "SIMULATION_START_DATE".
The left title just above the plot is from the variable's
"description" and "units" attributes.
The title above the labelbar is also from the variable's "description"
and "units" attributes.
The first line at the lower left of the page is from the global
attribute "TITLE".
The second line is constructed using global
attributes that describe the various spatial and level dimension
sizes, the distance in kilometers, and the various physics used
(MP_PHYSICS, BL_PBL_PHYSICS, CU_PHYSICS).
 wrf_title_2.ncl
: This script is
based on wrf_title_1.ncl, and shows how to change or add titles on a
WRF plot.
To change/add titles at the top right and left sides of the page, set
these two resources before
calling wrf_contour:
Adds a title just below the "Init" title, preceded by the word "Valid: "
res@TimeLabel = "Desired title for time label"
Adds adds a slightly larger title at the top left side of the page.
This title will be 1.5 times larger than the other WRF titles.
res@MainTitle = "Desired main title"
To change the left-justified title just above the plot, set these two
resources before
calling wrf_map_overlays:
  pltres@CommonTitle = True
  pltres@PlotTitle   = "Desired plot title"
Note: you cannot change the "Init" time label at this time. See the
next script for an example of how to turn it off.
 wrf_title_3.ncl
: This script is
based on wrf_title_1.ncl and shows how to turn off the three sets of
titles that are added.
wrf_contour:
  res@NoHeaderFooter = True   ; Turn off the top right "Init" title
                                     ; and the two bottom footer titles.
wrf_map_overlays:
pltres@NoTitles = True ; Turn off the left title just above the plot
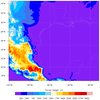
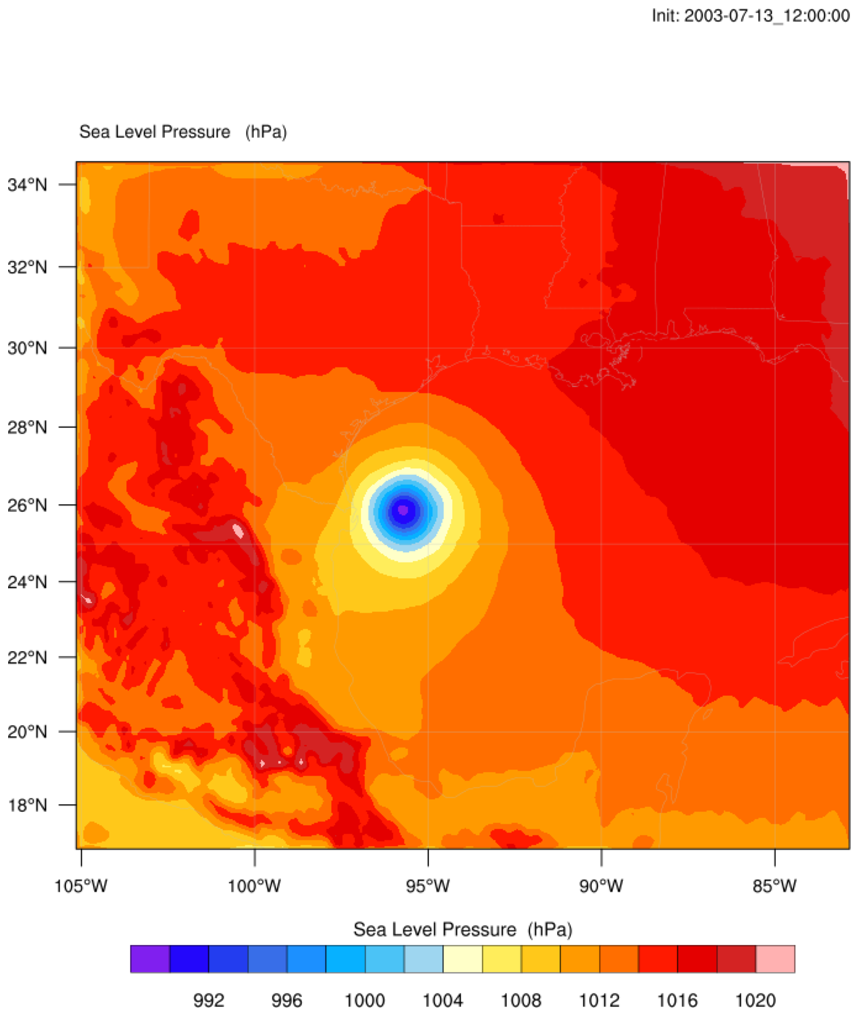
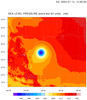 wrf_title_4.ncl
: By default,
the variable's description and units will appear twice on a color contour
plot: just above the plot and above the labelbar (see first frame).
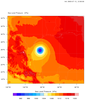
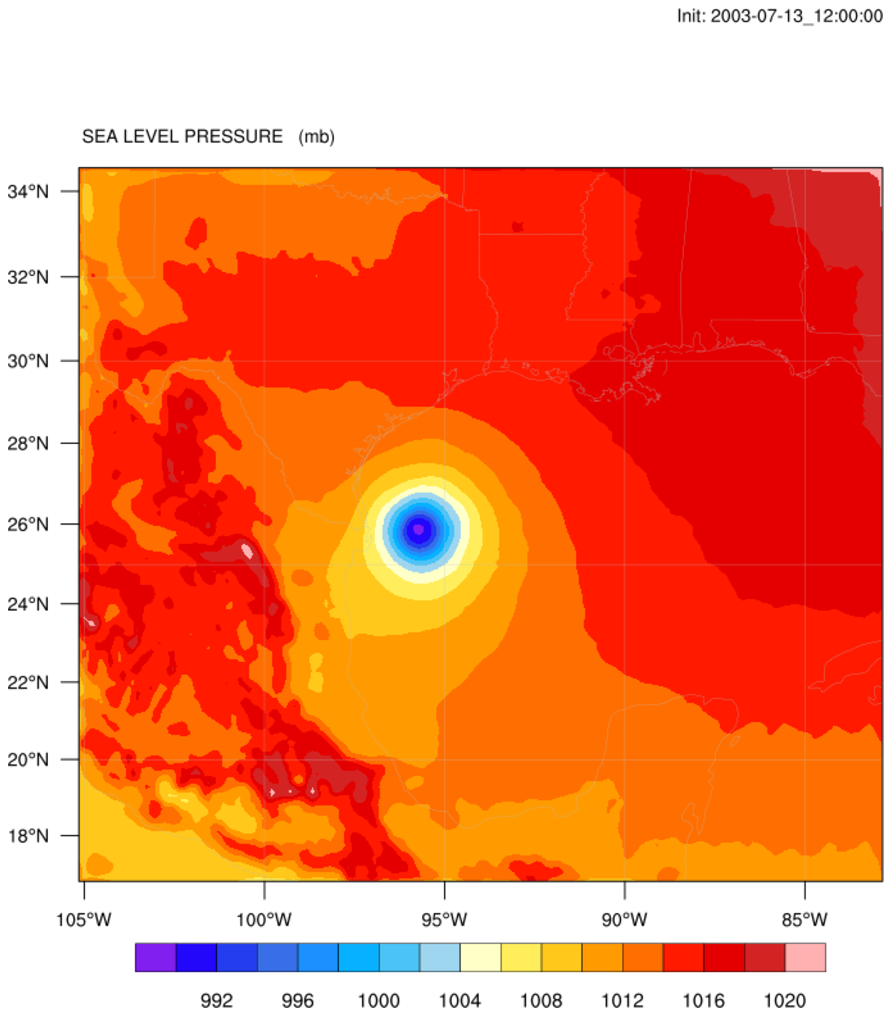
The second frame turns off the labelbar title and slightly changes the
title just above the plot:
  res@FieldTitle = "SEA LEVEL PRESSURE"  ; Change variable description
  res@UnitLabel  = "mb"                  ; Change variable units
  res@lbTitleOn  = False                 ; Turn off labelbar title
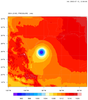
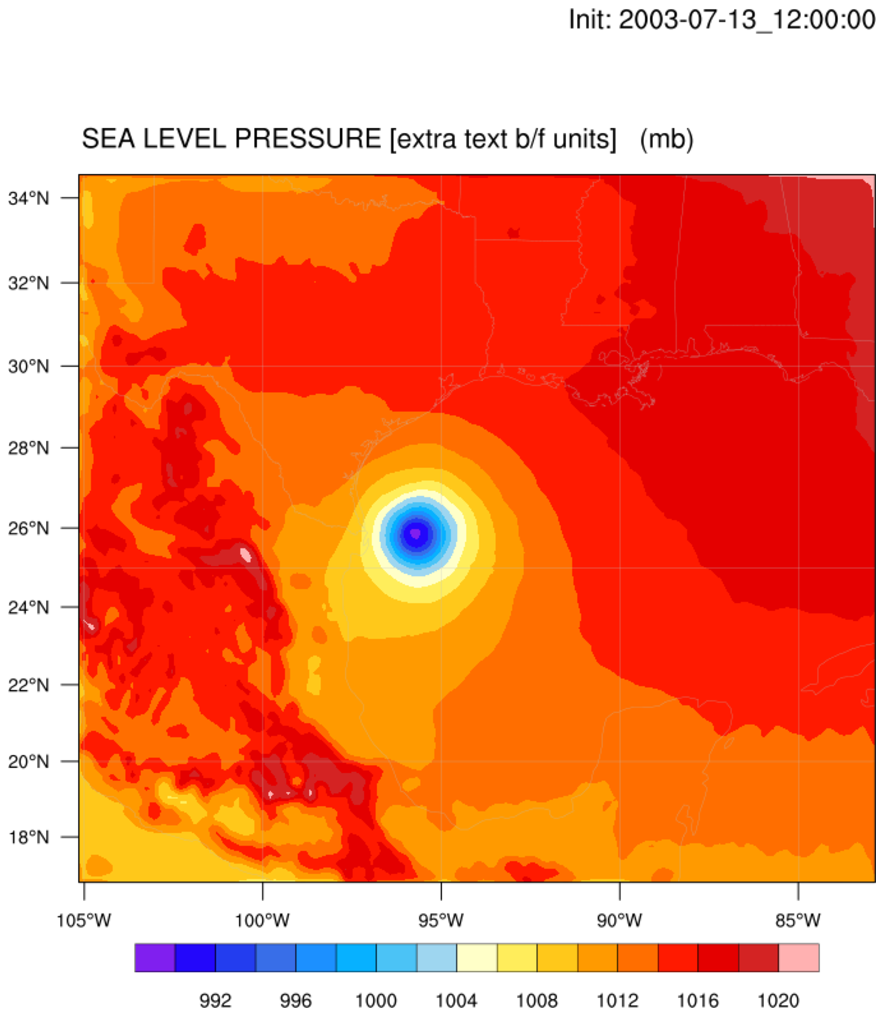
The third frame adds extra text to the field title, just
before the units, and increases the size of both titles
using the special FontHeightF resource.
res@SubFieldTitle = "[extra text b/f units]"
Note: the two footer strings were turned off in all plots
by setting:
res@Footer = False
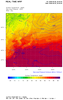
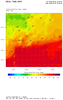 wrf_title_5.ncl
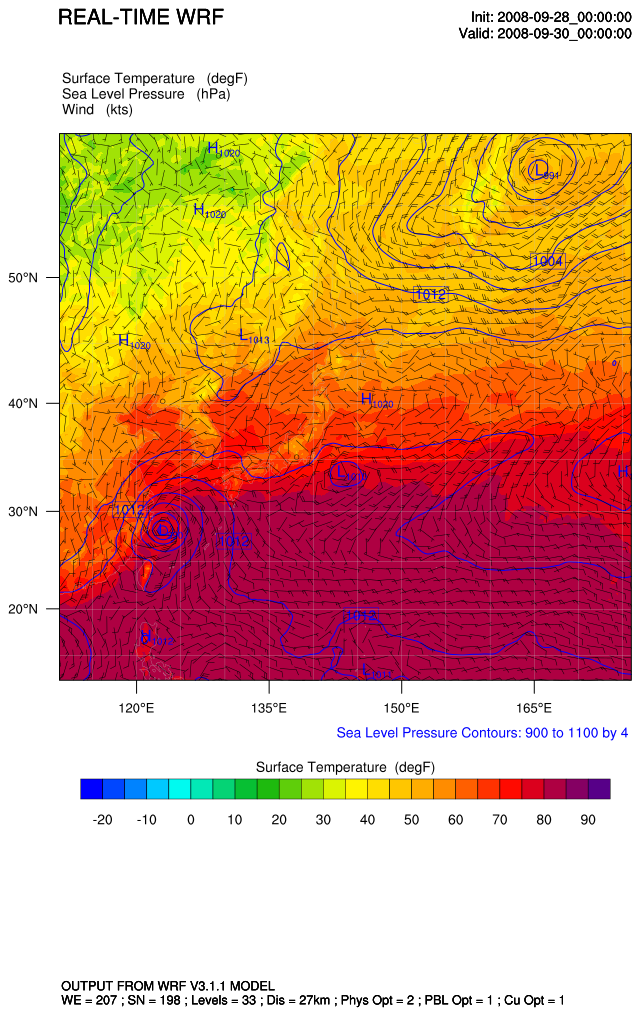
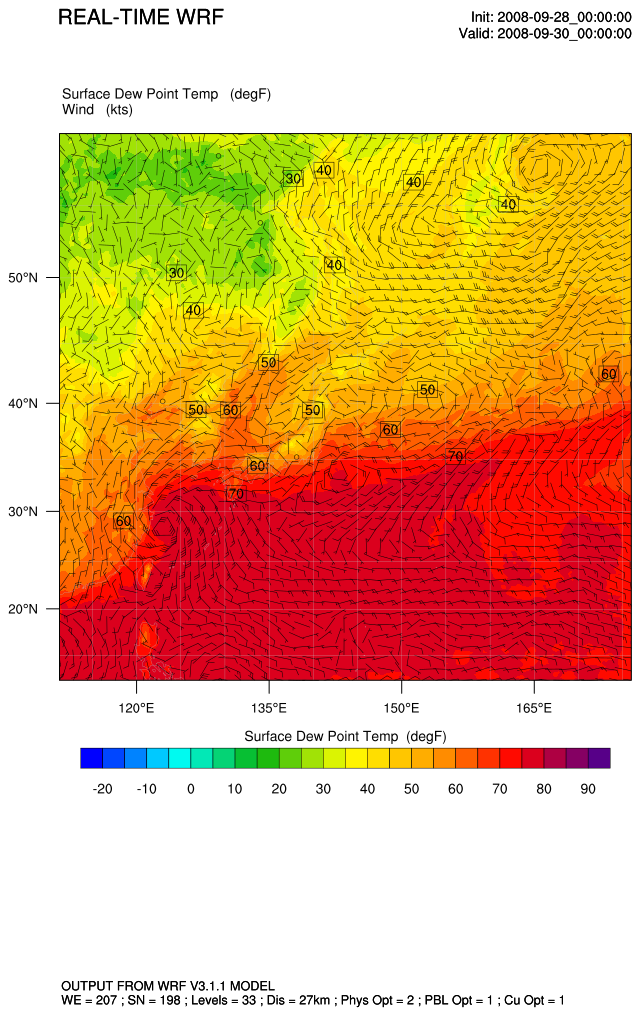
: This example
is a more elaborate one that shows how the left titles above
the plot are stacked when you overlay more than one plot.
The first frame overlays wind vectors on sea level pressure (blue
contour lines) on surface tempature (filled contours).
The second frame overlays wind vectors on surface dew point
temperature (filled contours).
A main title was added with res@MainTitle and the wind vector
title was changed using res@FieldTitle.
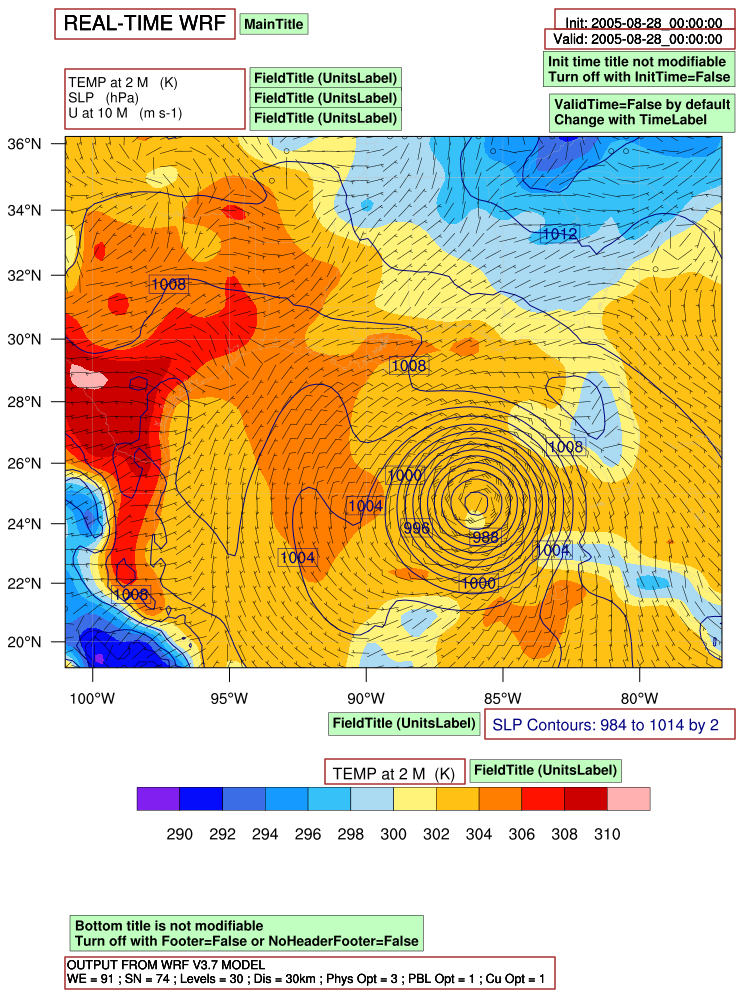
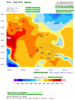 wrf_title_6.ncl
: This example
shows a typical WRF-ARW plot with several overlays (temperature, sea level pressure,
and vectors), with the various WRF titles annotated.


