pslhor
Computes sea level pressure from CCM/CAM hybrid model variables using the ECMWF formulation and Trenberth's horizontal correction.
Prototype
	function pslhor (
		z           : numeric,
		t           : numeric,
		phis [*][*] : numeric,
		ps          : numeric,
		pres        : numeric,
		lats    [*] : numeric
	)

	return_val  :  numeric
Arguments
zA multi-dimensional array containing geopotential height [m]. Must be at least three dimensions. The rightmost three dimensions must be level, lat and lon. The level dimension must be ordered bottom-to-top.
tA multi-dimensional array containing temperature in K. Must be the same size and ordering as z.
phisA two-dimensional array containing surface geopotential in m^2/s^2. The rightmost two dimensions must be lat and lon.
presA multi-dimensional array containing the pressures at each model in Pa. Must be the same size and ordering as z.
psA multi-dimensional array containing surface pressure in Pa. The rightmost three dimensions must be the same size as z.
latsA one-dimensional array equal to latitudes.
Return value
A multi-dimensional array of the same size as ps. Double if any of the input arguments is double, float otherwise.
Description
Computes sea level pressure using the ECMWF formulation and Trenberth's horizontal correction. The underlying code was taken directly from an old model post-processor that ran only on NCAR's Cray computers. It was developed for the 'old' CCM (Community Climate Model) hybrid model because the CCM did not output a sea level pressure variable. Also, at that time, the surface geopotential was constant. This function may be used with CAM hybrid model variables. However, generally, the CAM outputs the sea level pressure variable (PSL) and that should be used.
See Also
Examples
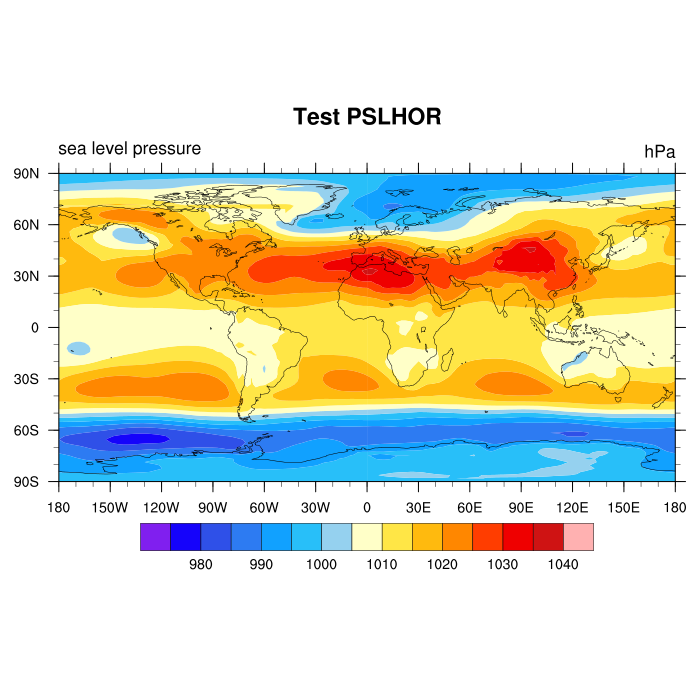
Example 1 Derive sea level pressure from CCM/CAM hybrid level variables. The image produced by the following code may be viewed here .
load "$NCARG_ROOT/lib/ncarg/nclscripts/csm/gsn_code.ncl"
load "$NCARG_ROOT/lib/ncarg/nclscripts/csm/gsn_csm.ncl"
load "$NCARG_ROOT/lib/ncarg/nclscripts/csm/contributed.ncl"

  diri = "./"
  fili = "ccsm35.h0.0021-01.demo.nc"                ; CAM hybrid model
  f    = addfile(diri+fili,"r")

  z    = f->Z3     ; (time,lev,lat,lon), [m]
  t    = f->T      ; (time,lev,lat,lon), [K]
  phis = f->PHIS   ; (time,lat,lon), [m2/s2]
  ps   = f->PS     ; (time,lat,lon), [Pa]
  lat  = f->lat    ; (lat)

                   ; calculate pressures at each grid point and level
  hyam = f->hyam   ; read from a file the mid-layer coef
  hybm = f->hybm   ; read from a file
  p0   = f->P0
  pres = pres_hybrid_ccm(ps,p0,hyam,hybm)  ; (ntim,klvl,nlat,lmon), [Pa]

                   ; get dimensions sizes
  dimt = dimsizes(t)
  ntim = dimt(0)
  klvl = dimt(1)
  nlat = dimt(2)
  mlon = dimt(3)

                         ; model fields are top-to-bottom
  z    = z(:,::-1,:,:)  ; documentation say 'bottom-to-top' [reorder]
  t    = t(:,::-1,:,:)
  pres = pres(:,::-1,:,:)


                   ; preallocate memory
  slp  = new( (/ntim,nlat,mlon/), typeof(ps), getFillValue(ps))

                   ; loop over all times
  do nt=0,ntim-1
      slp(nt,:,:) = pslhor(t(nt,:,:,:),phis(nt,:,:),ps(nt,:,:),pres(nt,:,:,:),lat)
  end do

  copy_VarMeta(ps,slp)
  slp           = slp*0.01                  ; change units to hPa (not necessary)
  slp@long_name = "sea level pressure"
  slp@units     = "hPa"


  printVarSummary(slp)
  print("slp: min="+min(slp)+"  max="+max(slp))

;**********************************************t*
; plotting parameters
;************************************************
  wks  = gsn_open_wks("png","tst_pslhor")

  res                       = True     ; plot mods desired
  res@gsnMaximize           = True     ; affects ps, eps, pdf only
  res@mpFillOn              = False    ; no land gray fill
  res@cnFillOn              = True     ; turn on color
  res@cnLinesOn             = False    ; turn off contour lines
  res@gsnPaperOrientation   = "portrait"

  res@cnLevelSelectionMode  = "ManualLevels"
  res@cnMinLevelValF        =   975.0
  res@cnMaxLevelValF        =  1040.0
  res@cnLevelSpacingF       =     5.0

  res@tiMainString          = "Test PSLHOR"

  nt    = 0   ; plot slp at 1st time step
  plot  = gsn_csm_contour_map_ce(wks,slp(nt,:,:),res) ; create a default plot