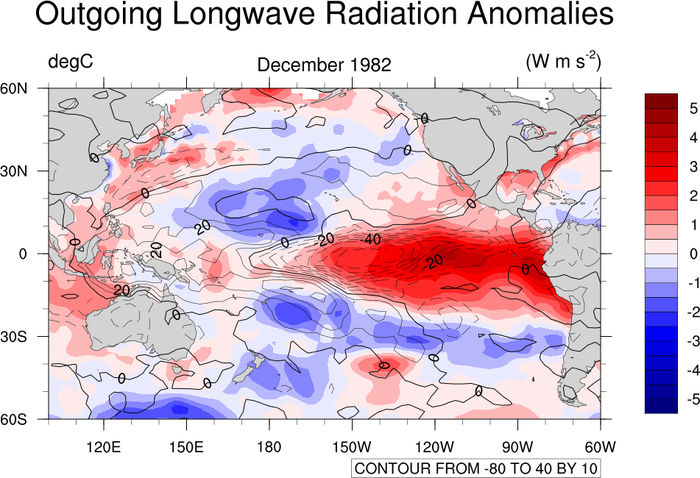
gsn_csm_contour_map_overlay
Creates and draws two contour plots over a map.
Prototype
load "$NCARG_ROOT/lib/ncarg/nclscripts/csm/gsn_code.ncl"  ; These two libraries are automatically
load "$NCARG_ROOT/lib/ncarg/nclscripts/csm/gsn_csm.ncl"   ; loaded from NCL V6.2.0 onward.
                                                          ; No need for user to explicitly load.

	function gsn_csm_contour_map_overlay (
		wks  [1] : graphic,
		data1    : numeric,
		data2    : numeric,
		res1 [1] : logical,
		res2 [1] : logical
	)

	return_val [1] :  graphic
Arguments
wksA Workstation identifier. The identifier is one returned either from calling gsn_open_wks or calling create to create a Workstation object.
data1The first set of data to contour; must be one- or two-dimensional.
data2The second set of data to contour; must be one- or two-dimensional.
res1A variable containing an optional list of plot resources, attached as attributes, to be applied to the first set of contour data and/or the map plot. Set this value to True if you want the attached attributes to be applied, and False if you either don't have any resources to set, or you don't want the resources applied.
res2A variable containing an optional list of plot resources, attached as attributes, to be applied to the second set of contour data. Set to True if you want the attached attributes to be applied, and False if you either don't have any resources to set, or you don't want the resources applied. Note that this resource is for the second contour plot only, and should not have any map ("mp") resources attached to it.
Return value
A scalar id of the map created is returned. The id of the first contour plot is returned as an attribute called contour and the id of the second contour plot as an attribute called contour2. This is useful if you want to use setvalues to change some data or contour options after this function has been called.
Description
This function creates and draws two separate contour plots over a map on the given workstation. The default projection is a cylindrical equidistant, which you can override by setting the mpProjection resource.
If either data1 or data2 are two-dimensional, then the leftmost dimension is represented on the Y (latitude) axis, and the rightmost dimension on the X (longitude) axis.
In order for the contours to be overlaid correctly on the map, please see the document "Overlaying data on a map".
The special resource gsnAddCyclic will be set to True so that a cyclic point will be added to the data. Set this resource to False if your data is not cyclic, or if you have already added the cyclic point in another fashion. If you see this error when you run your script:
warning:ScalarFieldSetValues: 2d coordinate array sfXArray has an incorrect dimension size: defaulting sfXArray
warning:ScalarFieldSetValues: 2d coordinate array sfYArray has an incorrect dimension size: defaulting sfYArray
then try setting gsnAddCyclic to False.
If data1 or data2 have a _FillValue attribute, these values will be used as a missing value.
If the resource cnFillOn is set to True, then the following will happen automatically:
- a labelbar will be automatically added (default horizontal)
- contour line labels will be turned off
- the contour information label will be turned off
For the map, the following will happen automatically:
- the continents will be colored gray
- the continental outlines will be turned off
- the latitude/longitude locations will be labeled
- the tickmarks will point outward (cylindrical equidistant map only)
If data1 has an attribute called "long_name" and gsnLeftString hasn't explicitly been set, then the value of this attribute is used for the left string title. If data1 has an attribute called "units" and gsnRightString hasn't explicitly been set, then the value of this attribute is used for the right string title. Note that you likely will want to set gsnLeftString and gsnRightString yourself, to better represent the two contour plots being overlaid.
To maximize the area that the plot is drawn in, set the special resource gsnMaximize to True.
See Also
gsn_contour,
gsn_csm_contour,
gsn_csm_contour_map,
gsn_csm_contour_map_ce,
gsn_csm_contour_map_polar
Special gsn resources
Examples
For some application examples, see: