GSUN > Examples > 1 | 2 | 3 | 4 | 5 | 6 | 7 | 8 | 9 | 10 | 11
Example 7 - two XY plots on one frame
This example illustrates the use of the routines ftcurvp and ftcurvpi and creates two XY plots on the same frame. It also illustrates how to draw text and polylines in a specified area of the viewport.The function ftcurvp calculates an interpolatory spline under tension through a sequence of functional values for a periodic function, and ftcurvpi calculates an integral of an interpolatory spline between two specified points.
To run this example, you must download the following file:
gsun07n.ncland then type:
ncl gsun07n.ncl
Output from example 7
| Frame 1 |
|---|
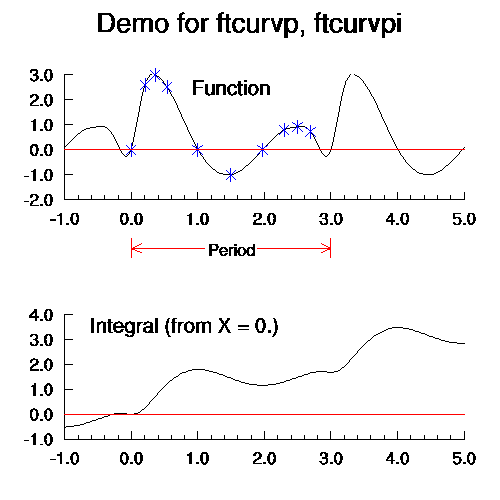
|
(Click on frame to see it enlarged.)
NCL code for example 7
  1. load "$NCARG_ROOT/lib/ncarg/nclscripts/csm/gsn_code.ncl"
  2.
  3. begin
  4.                                      ; Initialize some data.
  5.
  6.   xi = (/  0.000, 0.210, 0.360, 0.540, 1.000, 1.500, 1.970, 2.300, \
  7.            2.500, 2.700  /)
  8.   yi = (/  0.000, 2.600, 3.000, 2.500, 0.000,-1.000, 0.000, 0.800, \
  9.            0.920, 0.700  /)
 10.
 11.   npts   = 201
 12.   xl     = -1.0
 13.   xr     =  5.0
 14.   xo     = fspan(xl,xr,npts)  ; Create the output X coordinate array.
 15.
 16.   period = 3.0
 17.   yo = ftcurvp(xi, yi, period, xo)  ; Interpolate.
 18.
 19.   yint = new( (/ npts /), float)    ; Find the integrals
 20.   do i = 0, npts-1                  ; starting from x = 0.
 21.     yint(i) = ftcurvpi(0., xo(i), period, xi, yi)
 22.   end do
 23.
 24.   wks = gsn_open_wks("x11","gsun07n") ; Open an X11 workstation.
 25.
 26.   cmap = (/"white","black","red","green","blue","yellow"/)
 27.
 28.   gsn_define_colormap(wks,cmap) ; Define your own color map.
 29.
 30.
 31.   txres = True   ; Set up some variables for
 32.   xyres = True   ; creating three different
 33.   gsres = True   ; resource lists.
 34.
 35.   xyres@gsnFrame               = False     ; Don't advance the frame.
 36.
 37.   xyres@tmXTBorderOn           = False     ; Don't draw top axis.
 38.   xyres@tmXTOn                 = False     ; Don't draw top axis tick marks.
 39.   xyres@tmBorderThicknessF     = 1.0       ; Default thickness is 2.0
 40.
 41.   xyres@tmXBLabelFont          = 21        ; Change font and size of
 42.   xyres@tmXBLabelFontHeightF   = 0.025     ; X axis labels.
 43.   xyres@tmXBMajorLengthF       = 0.015     ; Default is 0.02.
 44.   xyres@tmXBMajorThicknessF    = 1.0       ; Default is 2.
 45.   xyres@tmXBMinorLengthF       = 0.0075    ; Default is 0.01.
 46.   xyres@tmXBMinorPerMajor      = 4         ; # of minor tick marks per major.
 47.   xyres@tmXBMode               = "Manual"  ; Set tick mark mode.
 48.   xyres@tmXBTickStartF         = -1.0
 49.   xyres@tmXBTickEndF           = 5.0
 50.   xyres@tmXBTickSpacingF       = 1.0
 51.   xyres@tmXMajorGridThicknessF = 1.0       ; Default is 2.0
 52.
 53.   xyres@tmYLLabelFont          = 21        ; See explanations for X axes
 54.   xyres@tmYLLabelFontHeightF   = 0.025     ; resources.
 55.   xyres@tmYLMajorLengthF       = 0.015
 56.   xyres@tmYLMajorThicknessF    = 1.0
 57.   xyres@tmYLMinorPerMajor      = 0
 58.   xyres@tmYLMode               = "Manual"
 59.   xyres@tmYLTickStartF         = -2.0
 60.   xyres@tmYLTickEndF           = 3.0
 61.   xyres@tmYLTickSpacingF       = 1.0
 62.   xyres@tmYRBorderOn           = False    ; Don't draw right axis.
 63.   xyres@tmYROn                 = False    ; Don't draw right axis tick marks.
 64.
 65.   xyres@trXMaxF   = xr  ; Specify data limits for X and Y axes.
 66.   xyres@trXMinF   = xl
 67.   xyres@trYMaxF   =  3.0
 68.   xyres@trYMinF   = -2.0
 69.
 70.   xyres@vpHeightF = 0.25 ; Define height, width, and location of plot.
 71.   xyres@vpWidthF  = 0.80
 72.   xyres@vpXF      = 0.13
 73.   xyres@vpYF      = 0.85
 74.
 75.   xy = gsn_xy(wks,xo,yo,xyres) ; Plot the interpolated values.
 76.
 77.   xyres@xyMarkLineMode = "Markers"  ; Set line mode to "Markers".
 78.   xyres@xyMarkerColor  = "blue"     ; Set markers to blue.
 79.   xyres@xyMarkerSizeF  = 0.025      ; Make markers larger.
 80.
 81.   xy = gsn_xy(wks,xi,yi,xyres) ; Plot the original points with markers.
 82.
 83.   txres@txFont        = 21                  ; Change the default font.
 84.   txres@txFontHeightF = 0.03                ; Set the font height.
 85.   gsn_text(wks,xy,"Function",1.5,2.5,txres) ; Label the plot.
 86.
 87.   xx = (/xl,xr/)   ; Create data for a polyline for marking
 88.   yy = (/0.0,0.0/) ; the Y = 0.0 line in each graph.
 89.
 90.   gsres@gsLineColor = "red"            ; Set polyline color to red.
 91.   gsn_polyline(wks,xy,xx,yy,gsres)     ; Draw polyline at Y=0.
 92.
 93. ;----------- Begin second plot, same frame--------------------------------
 94.
 95.   xyres@vpYF             = 0.37    ; Set Y location of plot.
 96.
 97.   xyres@trYMinF          = -1.0    ; Set minimum Y axis value.
 98.   xyres@trYMaxF          =  4.0    ; Set maximum Y axis value.
 99.
100.   xyres@tmYLTickStartF   = -1.0    ; Define tick mark spacing
101.   xyres@tmYLTickSpacingF =  1.0    ; along Y axis.
102.   xyres@tmYLTickEndF     =  4.0
103.
104.   xyres@xyMarkLineMode   = "Lines" ; Set line mode to "Lines".
105.
106.   xy = gsn_xy(wks,xo,yint,xyres)  ; Plot the integrals.
107.
108.   txres@txFontHeightF = 0.03                              ; Set font height.
109.   gsn_text(wks,xy,"Integral (from X = 0.)",0.8,3.5,txres) ; Label plot.
110.
111.   gsn_polyline(wks,xy,xx,yy,gsres) ; Draw polyline at Y=0.
112.
113.   txres@txFontHeightF = 0.04  ; Change the font height.
114.
115.   gsn_text_ndc(wks,"Demo for ftcurvp, ftcurvpi",.5,.95,txres)
116.
117.   xperiod1 = (/.41,   .2633, .2633, .2633, .2833, .2633, .2833, .2633, .2633/)
118.   xperiod2 = (/.5166, .6633, .6633, .6633, .6433, .6633, .6433, .6633, .6633/)
119.   yperiod  = (/.503,  .503,  .523,  .503,  .513,  .503,  .493,  .503,  .483/)
120.
121.   gsn_polyline_ndc(wks,xperiod1,yperiod,gsres)  ; Draw a period legend.
122.   gsn_polyline_ndc(wks,xperiod2,yperiod,gsres)  ; between the two plots.
123.
124.   txres@txFontHeightF = 0.024                ; Set font height.
125.   gsn_text_ndc(wks,"Period",0.465,0.5,txres) ; Label the period legend.
126.
127.   frame(wks)        ; Advance the frame.
128.
129.   delete(xy)        ; Clean up.
130.   delete(txres)
131.   delete(gsres)
132.   delete(xyres)
133. end
Explanation of example 7
Lines 6-9:
  xi = (/  0.000, 0.210, 0.360, 0.540, 1.000, 1.500, 1.970, 2.300, \
           2.500, 2.700  /)
  yi = (/  0.000, 2.600, 3.000, 2.500, 0.000,-1.000, 0.000, 0.800, \
           0.920, 0.700  /)
Create two 1-dimensional arrays of 10 points each containing the
input data.
  npts   = 201
  xl     = -1.0
  xr     =  5.0
  xo     = fspan(xl,xr,npts)
Create the output X coordinate array using the function fspan, which creates a span of evenly spaced floating point numbers given the floating point value to start at, the floating point value to end with, and the number of evenly spaced points to create in between.
  period = 3.0
  yo = ftcurvp(xi, yi, period, xo)
Calculate an interpolatory spline under tension through a sequence of functional values for a periodic function using the function ftcurvp. The variable xi is a 1-dimensional array (10 elements) containing the abscissae for the input function, yi. The variable period is a scalar value specifying the period of the input function, and xo is a 1-dimensional array containing the abscissae for the interpolated values. ftcurvp returns a 1-dimensional array that contains the interpolated functional values at the points specified in xo.
Note that the output X coordinate array you are specifying goes from -1.0 to 5.0, while the input X array you specified earlier only goes from 0.0 to 2.7. Since ftcurvp takes as input the period of the function, it uses this period to repeat values that fall outside the input X range specified.
  yint = new( (/ npts /), float)
  do i = 0, npts-1
    yint(i) = ftcurvpi(0., xo(i), period, xi, yi)
  end do
Calculate an integral of an interpolatory spline between two specified
points using the function ftcurvpi.
The first argument to ftcurvpi is a scalar value containing
the lower limit of the integration, the second argument is a scalar
value containing the upper limit of the integration, and the third
argument is a scalar value specifying the period of the input
function. The last two arguments are 1-dimensional arrays (both 10
elements each) containing the abscissae for the input function and the
input function itself.
  cmap = (/"white","black","red","green","blue","yellow"/)

  gsn_define_colormap(wks,cmap)
Define a color map using named colors. A list of the 650 valid color names is in the file "$NCARG_ROOT/lib/ncarg/database/rgb.txt."
Note: you can mix and match color names with RGB values, as long as you enclose each entry in double quotes. For example, if you want a white background, a black foreground, and some other colors defined by RGB values, then you can define your color map as follows:
  cmap = (/"white","black","(/.56,.50,.70/)","(/.30,.30,.70/)",\
           "(/.10,.10,.70/)","(/.00,.10,.70/)","(/.00,.30,.70/)",\
           "(/.00,.50,.50/)","(/.00,.70,.10/)","(/.06,.68,.00/)"/)

  gsn_define_named_colormap(wks,cmap)
For more information on named colors, see the section "Creating your own
color map using named colors and RGB values" in the "Basics"
chapter.
  txres = True
  xyres = True
  gsres = True
Create some logical values to contain resource attributes for text, XY plots, and general primitives.
xyres@gsnFrame = FalseSince you are drawing two XY plots on one page, and then drawing markers and text on top, you don't want the frame to be advanced automatically after each XY plot is drawn.
  xyres@tmXTBorderOn           = False
  xyres@tmXTOn                 = False
  xyres@tmBorderThicknessF     = 1.

  xyres@tmXBLabelFont          = 21
  xyres@tmXBLabelFontHeightF   = 0.025
  xyres@tmXBMajorLengthF       = 0.015
  xyres@tmXBMajorThicknessF    = 1.0
  xyres@tmXBMinorLengthF       = 0.0075
  xyres@tmXBMinorPerMajor      = 4
  xyres@tmXBMode               = "Manual"
  xyres@tmXBTickStartF         = -1.0
  xyres@tmXBTickEndF           = 5.0
  xyres@tmXBTickSpacingF       = 1.0
  xyres@tmXMajorGridThicknessF = 1.0
Set some resources for controlling the tick marks on the X axes. By default, the border and tick marks are put on both the bottom and the top of the plot, so setting both tmXTBorderOn and tmXTOn to False turns off the drawing of the top border and tick marks ("XT" stands for "X Top").
Setting tmXBMode to "Manual" allows you to define where to place major tick marks. Starting with the value tmXBTickStartF, major tick marks are placed at intervals separated by a distance of tmXBTickSpacingF until tmXBTickEndF is exceeded.
The rest of the tick mark resources define how many minor tick marks should be drawn between major tick marks, what font and height to use for the labels, and how thick and long to make the tick marks.
  xyres@tmYLLabelFont          = 21
  xyres@tmYLLabelFontHeightF   = 0.025
  xyres@tmYLMajorLengthF       = 0.015
  xyres@tmYLMajorThicknessF    = 1.0
  xyres@tmYLMinorPerMajor      = 0
  xyres@tmYLMode               = "Manual"
  xyres@tmYLTickStartF         = -2.0
  xyres@tmYLTickEndF           = 3.0
  xyres@tmYLTickSpacingF       = 1.0
  xyres@tmYRBorderOn           = False
  xyres@tmYROn                 = False
These resources are the same as those for the X axis described above, only they apply to the left Y axis. The drawing of the right Y axis is turned off by setting both tmYRBorderOn and tmYROn to False ("YR" stands for "Y Right").
  xyres@trXMaxF   = xr
  xyres@trXMinF   = xl
  xyres@trYMaxF   =  3.0
  xyres@trYMinF   = -2.0
There are many different kinds of resources that you can set for putting the data through some kind of transformation. One set of these, the MapTransformation resources, was introduced in example 5. There are other types of non-map transformation resources that you can set for reversing the data in the X or Y axis direction and setting the upper or lower bounds of the axis values and using log scaling. There's also a set of IrregularTransformation resources for managing forward and reverse transformations in an irregular rectangular coordinate space.
To control the X and Y axis limits of the data values, you need to use the Transformation resources trXMinF, trXMaxF, trYMinF, and trYMaxF.
The first curve you are about to plot goes from -1.0 to 5.0 in the X direction, and from -1.01 to 3.02 in the Y direction. The second curve goes from 0.0 to 2.7 in the X direction and -1.0 to 3.0 in the Y direction. By setting trXMinF to xl (-1.0), trXMaxF to xr (5.0), trYMinF to -2.0 and trYMaxF to 3.0, only the data from the curves that go from -1.0 to 5.0 in the X direction and -2.0 to 3.0 in the Y direction are plotted. Note that for the second curve, these limits are actually outside the range of the actual data values.
  xyres@vpHeightF = 0.25
  xyres@vpWidthF  = 0.80
  xyres@vpXF      = 0.13
  xyres@vpYF      = 0.85
Set some resources to change the size and location of the first plot drawn in the viewport. The viewport is discussed in more detail in example 5.
xy = gsn_xy(wks,xo,yo,xyres)Draw an XY plot of the interpolated values.
  xyres@xyMarkLineMode = "Markers"
  xyres@xyMarkerColor  = "blue"
  xyres@xyMarkerSizeF  = 0.025

  xy = gsn_xy(wks,xi,yi,xyres)
Draw an XY plot of the original points using markers, right on top of the first XY plot you just drew. Since the only thing you changed from the first plot to the second plot was a few resources for setting the line mode to "Markers" and the data in the gsn_xy arguments, this second plot is drawn in the exact same place as the first plot, and has the same tick marks and X/Y axis values. (Remember, the frame advance resource gsnFrame was previously set to False.)
  txres@txFont        = 21
  txres@txFontHeightF = 0.03
  gsn_text(wks,xy,"Function",1.5,2.5,txres)
Put a label on the two plots you just created using gsn_text. The procedure gsn_text is similar to gsn_text_ndc, only the position of text is specified according to the data space of the plot (rather than NDC coordinates), which is passed as the second argument to gsn_text. In this case, you are passing in xy, which is the value returned from the last call to gsn_xy.
  xx = (/xl,xr/)
  yy = (/0.0,0.0/)

  gsres@gsLineColor = "red"
  gsn_polyline(wks,xy,xx,yy,gsres)
Using gsn_polyline, draw a polyline for marking the Y = 0.0 line. The first argument of gsn_polyline is the workstation variable returned from a previous call to gsn_open_wks, and the second argument is the plot id of the plot to draw the polyline on (returned from a previous call to one of the gsn_* plotting functions). To draw the polyline on the XY plots you just drew, pass xy as the plot id. The next two arguments are the X and Y locations of each point defining the polyline to plot (they must be in the same data space as the data in xy), and the last argument is a logical value indicating whether you have set any resources. You are using resources here to change the default color of the polyline.
The procedure gsn_polyline is part of a set of procedures for drawing output primitives. The other primitive procedures draw markers (gsn_polymarker, gsn_polymarker_ndc), filled areas (gsn_polygon, gsn_polygon_ndc), and text (gsn_text, gsn_text_ndc). Output primitive resources (with the exception of text resources) belong to the "GraphicStyle" group and start with the letters "gs". Each resource is documented with its type and its default value in the "Graphic Style resource descriptions. The text resources belong to the "TextItem" group as described in example 5.
Note: Using gsn_polyline to draw a line at Y = 0.0 is not really necessary in this case. You could have made this line a part of the XY plot by creating a second curve and passing it to gsn_xy along with the first curve in line 81 . gsn_polyline is being used here just to show how to use it.
;----------- Begin second plot, same frame--------------------------------Draw another XY plot on the same frame, below the first XY plot you just drew. For a given X coordinate, the plotted Y value is the integral from 0 to X of the function in the first XY plot.
xyres@vpYF = 0.37To draw the second XY plot below the first XY plot, change the value of vpYF to change the Y position of the second plot.
  xyres@trYMinF          = -1.0
  xyres@trYMaxF          =  4.0
Change the minimum and maximum values of the lower and upper bounds of the Y axis.
  xyres@tmYLTickStartF   = -1.0
  xyres@tmYLTickSpacingF =  1.0
  xyres@tmYLTickEndF     =  4.0
Create some "nice" values for the tick marks. If you don't set these resources, then you get tick marks at values that NCL selects, which in this case end up being at -1, 0, 1, 2, and 3 (no tick mark at 4).
  xyres@xyMarkLineMode   = "Lines"

  xy = gsn_xy(wks,xo,yint,xyres)
Change the line drawing mode back to "Lines" and draw a new XY plot of the integral values.
  txres@txFontHeightF = 0.03
  gsn_text(wks,xy,"Integral (from X = 0.)",0.8,3.5,txres)
Label the XY plot you just drew using gsn_text in the data space of the new XY plot just created.
gsn_polyline(wks,xy,xx,yy,gsres)Draw a polyline for marking the Y = 0.0 line.
  txres@txFontHeightF = 0.04

  gsn_text_ndc(wks,"Demo for ftcurvp, ftcurvpi",.5,.95,txres)
Put a label at the top of the viewport using the gsn_text_ndc procedure which allows you to draw text anywhere in the viewport. The first argument of gsn_text_ndc is the workstation variable returned from the previous call to gsn_open_wks and the second argument is the string to draw. The next two arguments are the X and Y locations of the text in NDC coordinates, and the last argument is a logical value indicating whether you have set any resources. You are using resources here to change the font height from the default.
  xperiod1 = (/.41,   .2633, .2633, .2633, .2833, .2633, .2833, .2633, .2633/)
  xperiod2 = (/.5166, .6633, .6633, .6633, .6433, .6633, .6433, .6633, .6633/)
  yperiod  = (/.503,  .503,  .523,  .503,  .513,  .503,  .493,  .503,  .483/)

  gsn_polyline_ndc(wks,xperiod1,yperiod,gsres)
  gsn_polyline_ndc(wks,xperiod2,yperiod,gsres)

  txres@txFontHeightF = 0.024
  gsn_text_ndc(wks,"Period",0.465,0.5,txres)
Draw and label a period legend (two arrows with the word "period" between them) below the first plot indicating the period of the input function. Since the legend falls outside either of the XY plots, you need to use gsn_polyline_ndc to draw it in NDC space.
The procedure gsn_polyline_ndc is similar to gsn_polyline, only the X and Y positions of each point in the line are specified in NDC coordinates instead of in a plot's data space coordinates.
frame(wks)Now that you've drawn all the components of the frame, call frame to advance the frame of the workstation.