NCL scripts for plotting IPSL data
[Main page | Scripts | Data]Note: the scripts on this page were meant to be used as a set of step-by-step examples for the NCL Workshops held in Toulouse, October 2012. Some of these scripts are very basic and not appropriate for real-world use. If you want to use the scripts on this page, we recommend using the ones with the higher numbers; for example, "IPSL_thetao_4.ncl" rather than "IPSL_thetao_1.ncl". Please also visit the Toulouse models applications page.
[Click on any image to see a larger version.]
| The file used for these plots is
"FRCCORE2_e_1m_19980101_20071231_thetao.nc" provided by Sophie Valcke, CERFACS. | |||
IPSL_thetao_1.ncl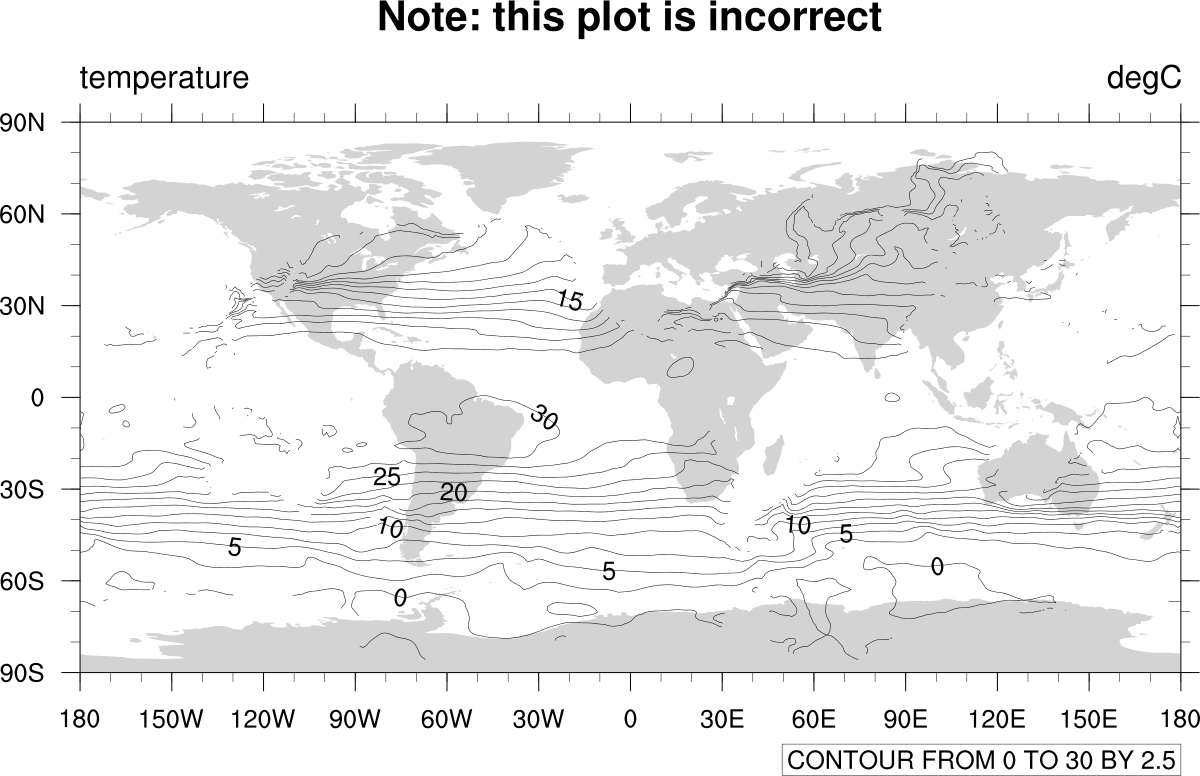
| IPSL_thetao_2.ncl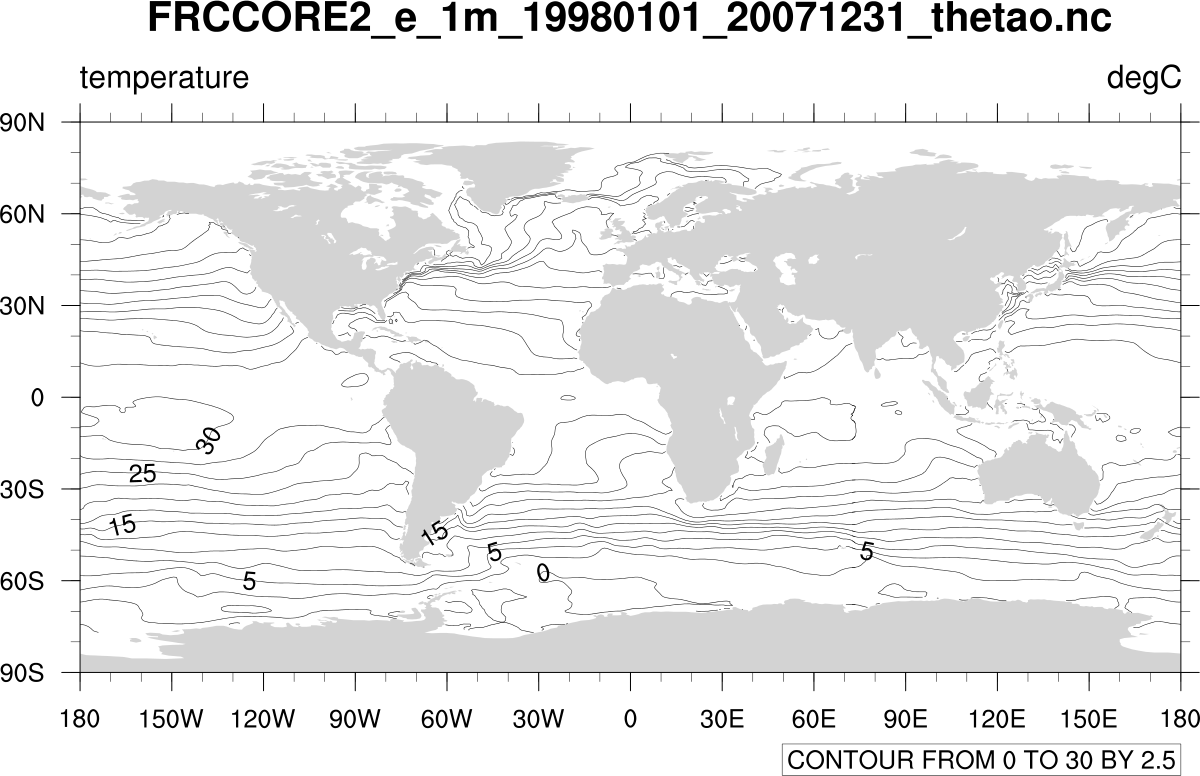
| IPSL_thetao_3.ncl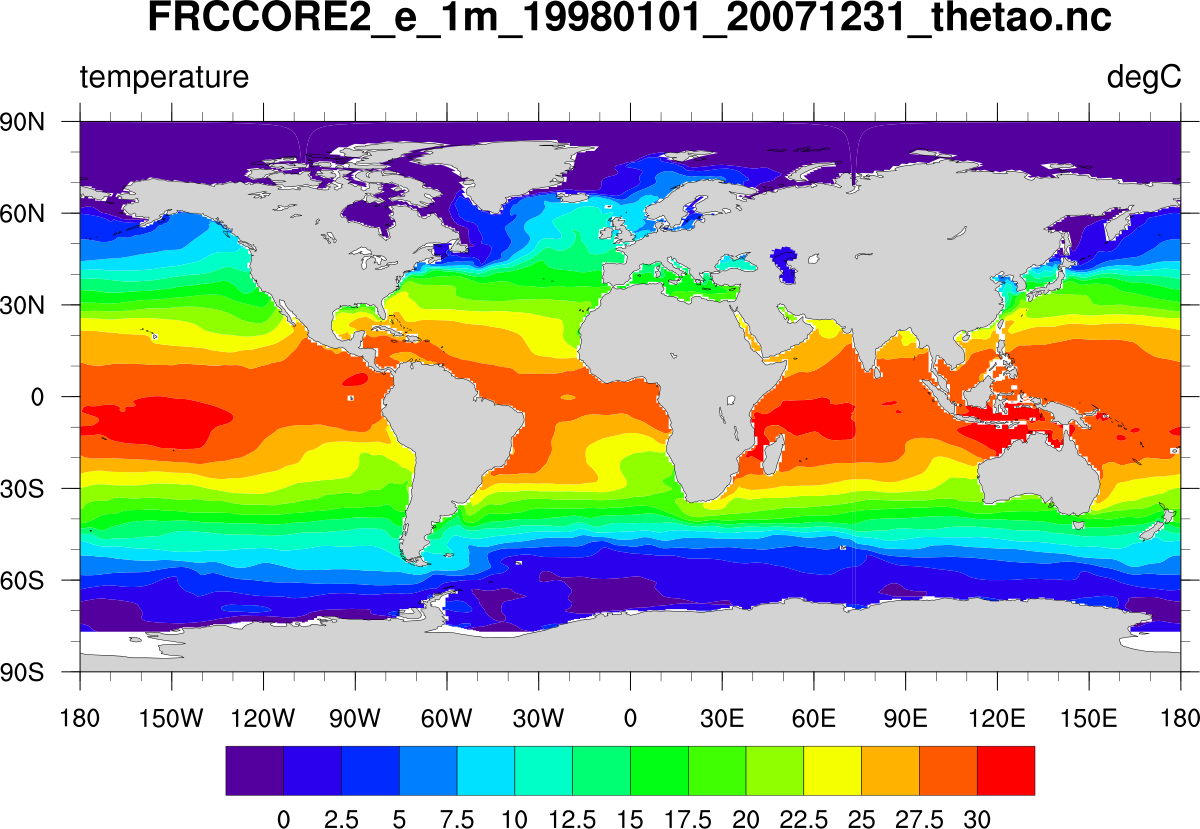
| IPSL_thetao_4.ncl
|
| To create an animation of the above, run IPSL_thetao_5.ncl. You must have the "convert" tool installed. A file called "IPSL_thetao_5.gif" will be created, which you can open with your web browser to see the animation. | |||
| The file used for this plot is "FRCCORE2_f_1m_19980101_20071231_thetao.nc" provided by Sophie Valcke, CERFACS. The NCL script is identical to IPSL_theta_4.ncl above, except with a different NetCDF file. | IPSL_thetao_4f.ncl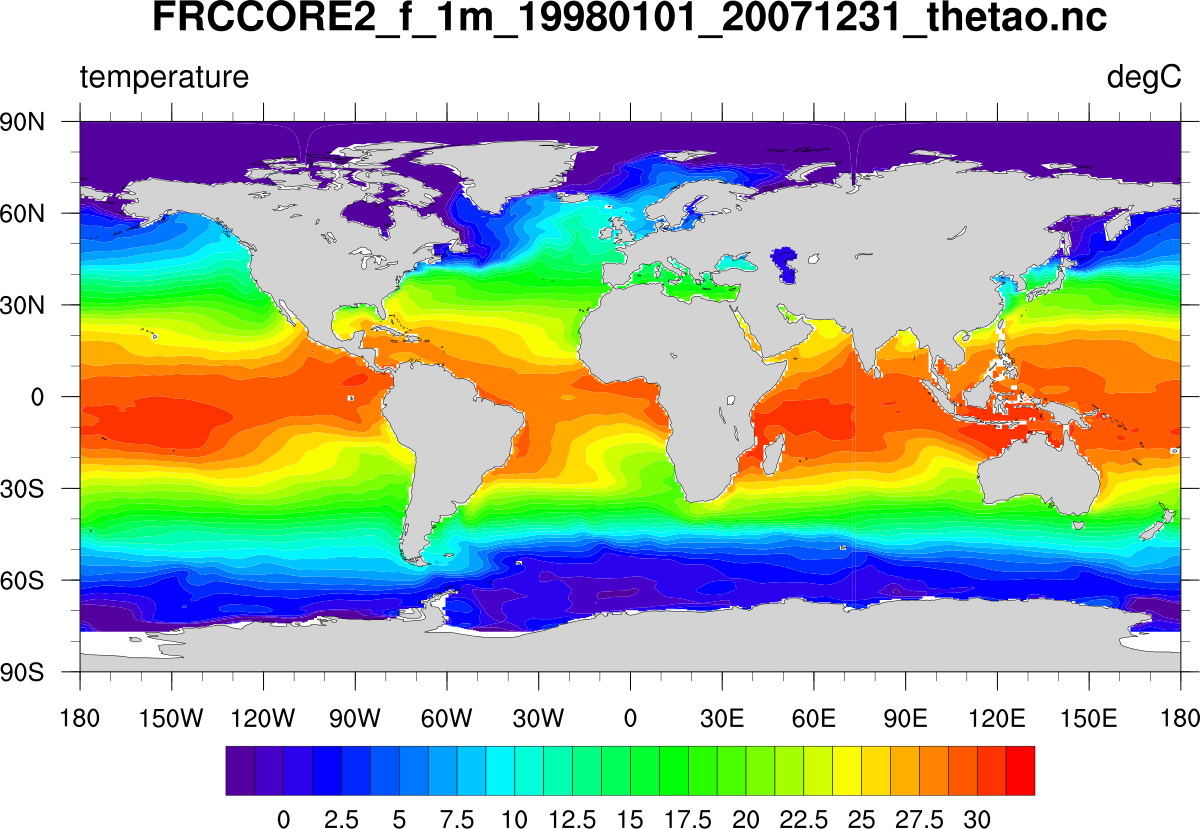
|
| These examples show how to panel plots. | |||
IPSL_thetao_panel_1.ncl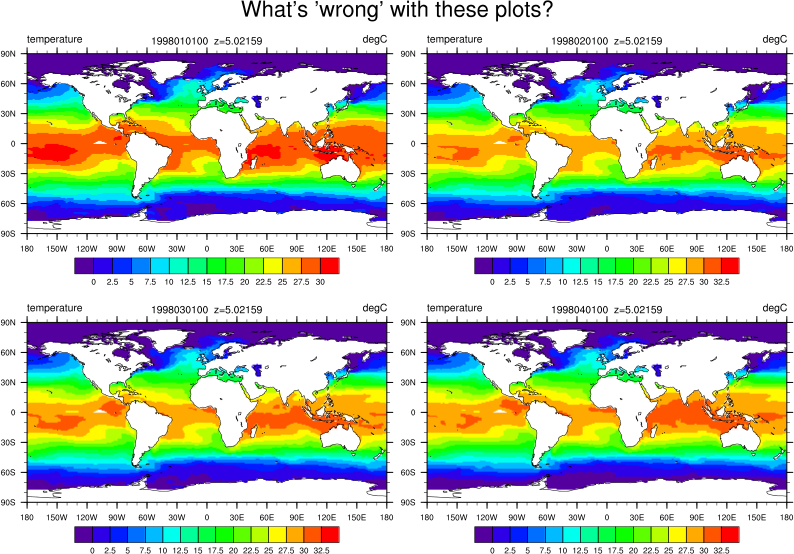
| IPSL_thetao_panel_2.ncl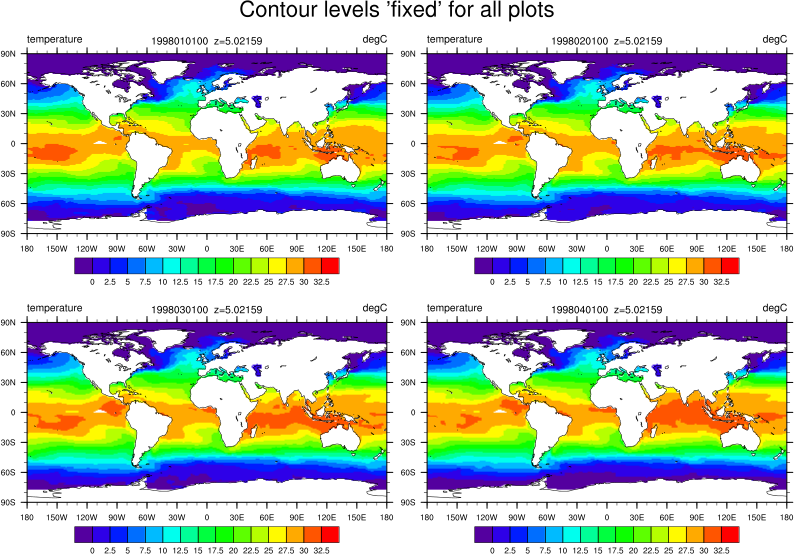
| IPSL_thetao_panel_3.ncl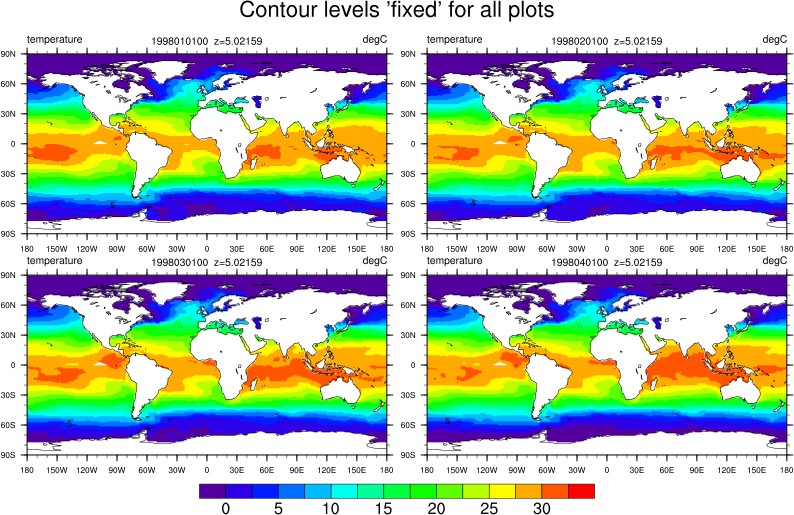
| IPSL_thetao_panel_4.ncl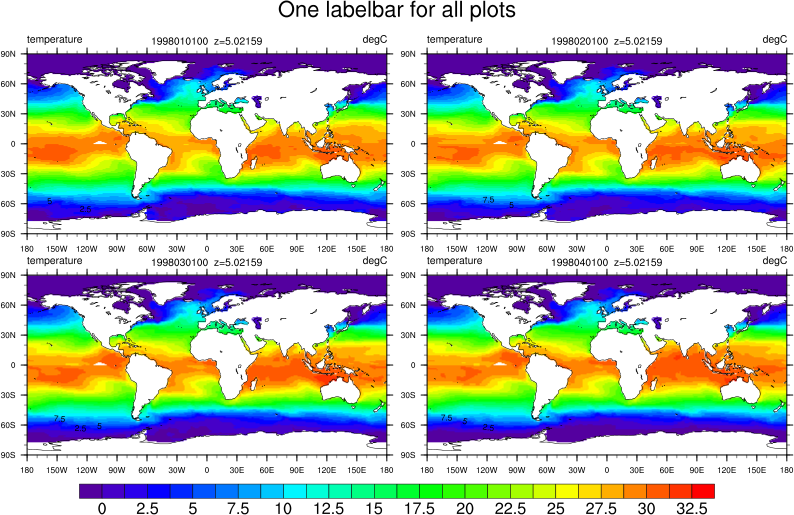
|