NCL scripts for plotting NEMO data
[Main page | Scripts | Data]
NEMO Home Page
Note: the scripts on this page were meant to be used as a set of step-by-step examples for the NCL Workshops held in Toulouse, October 2012. Some of these scripts are very basic and not appropriate for real-world use. If you want to use the scripts on this page, we recommend using the ones with the higher numbers; for example, "CNTASN_vosaline_8.ncl" rather than "CNTASN_vosaline_1.ncl". Please also visit the Toulouse models applications page.
| File used for these plots is "CNTASN_1m_200103_grid_T.nc",
provided by Clotilde Dubois, Météo-France. Click on any image to see a larger version. | ||
CNTASN_vosaline_1.ncl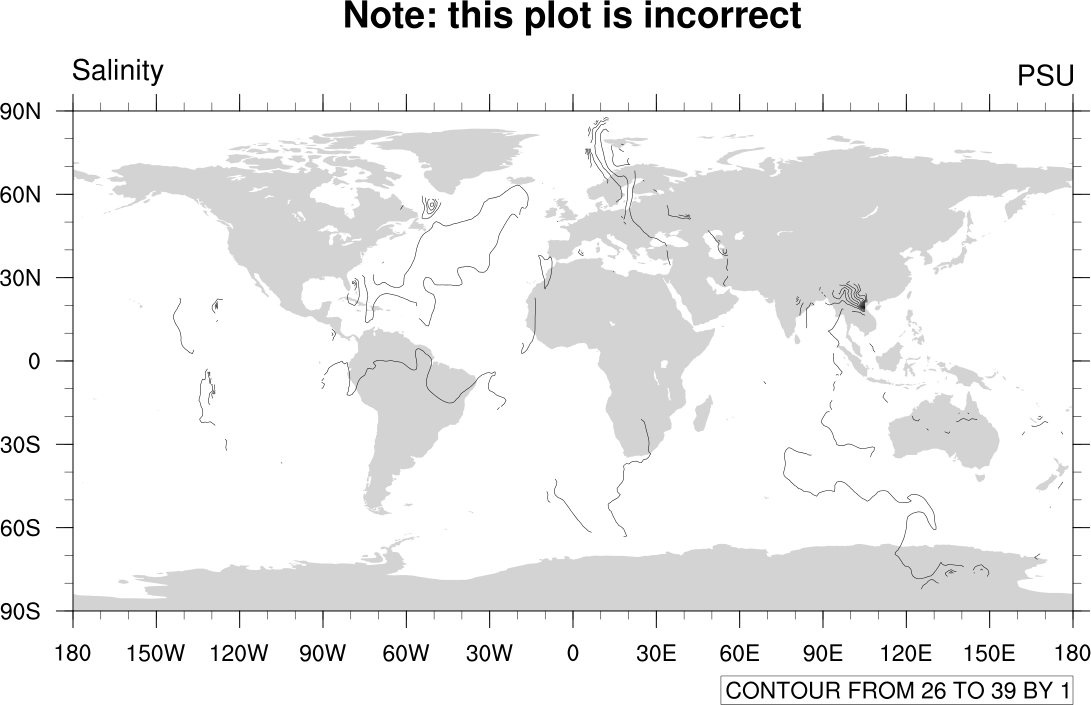
| CNTASN_vosaline_2.ncl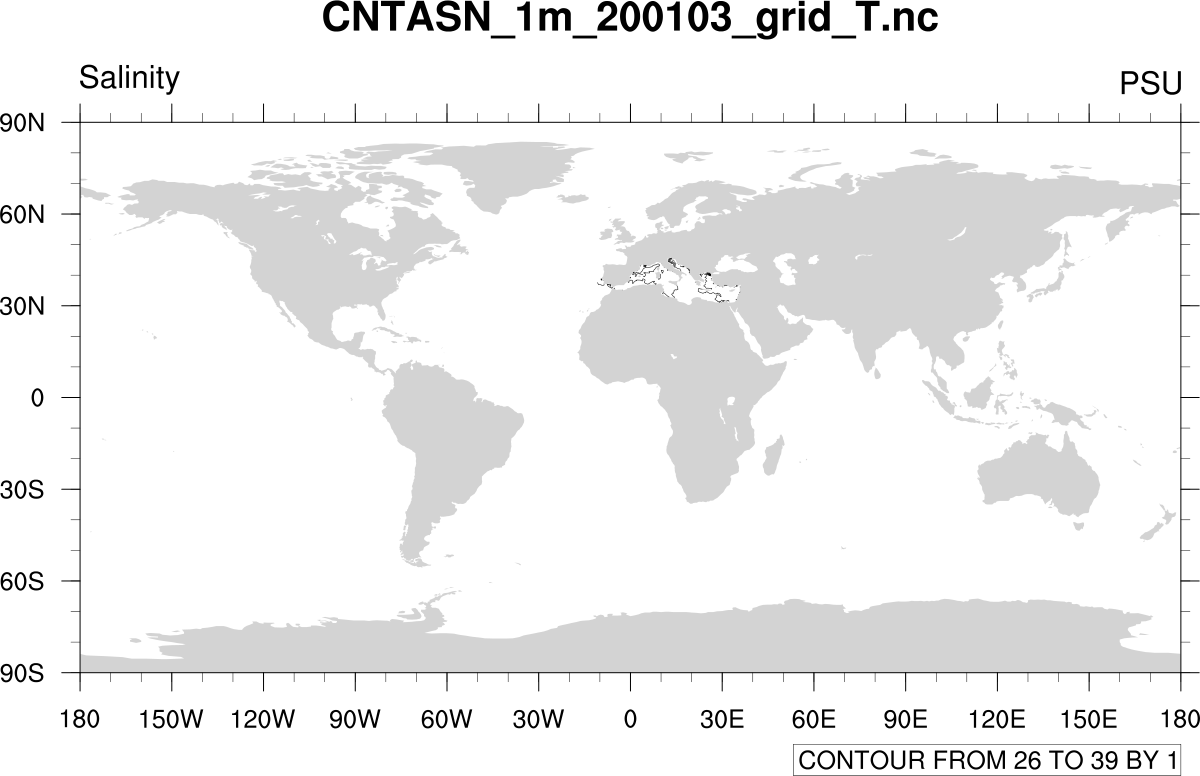
| CNTASN_vosaline_3.ncl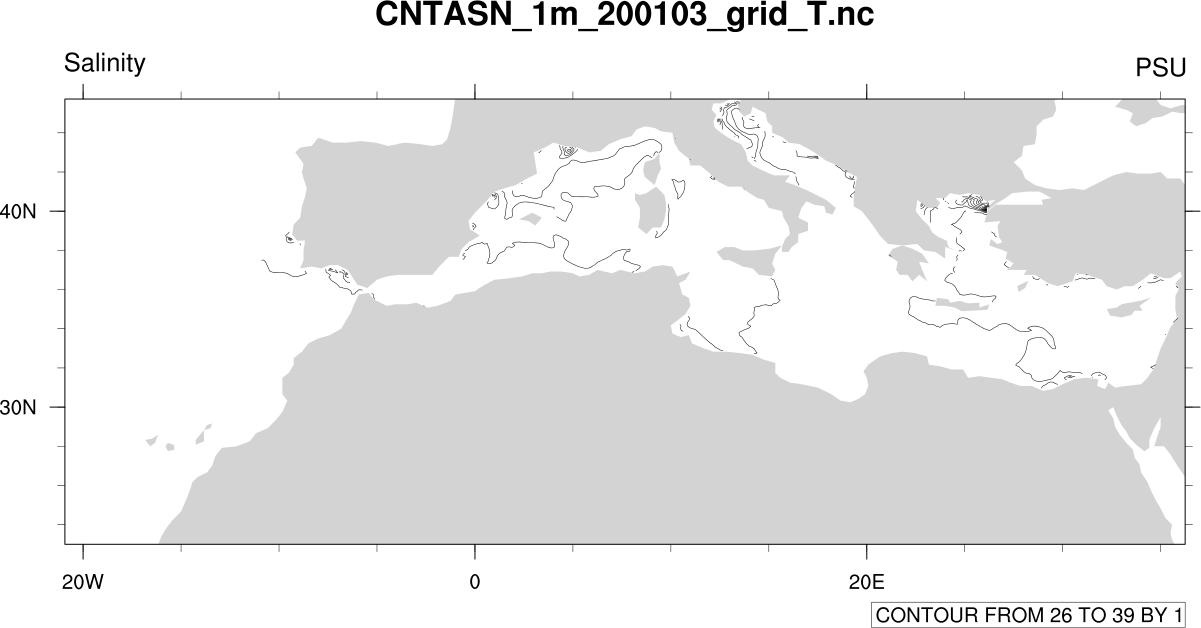
|
CNTASN_vosaline_4.ncl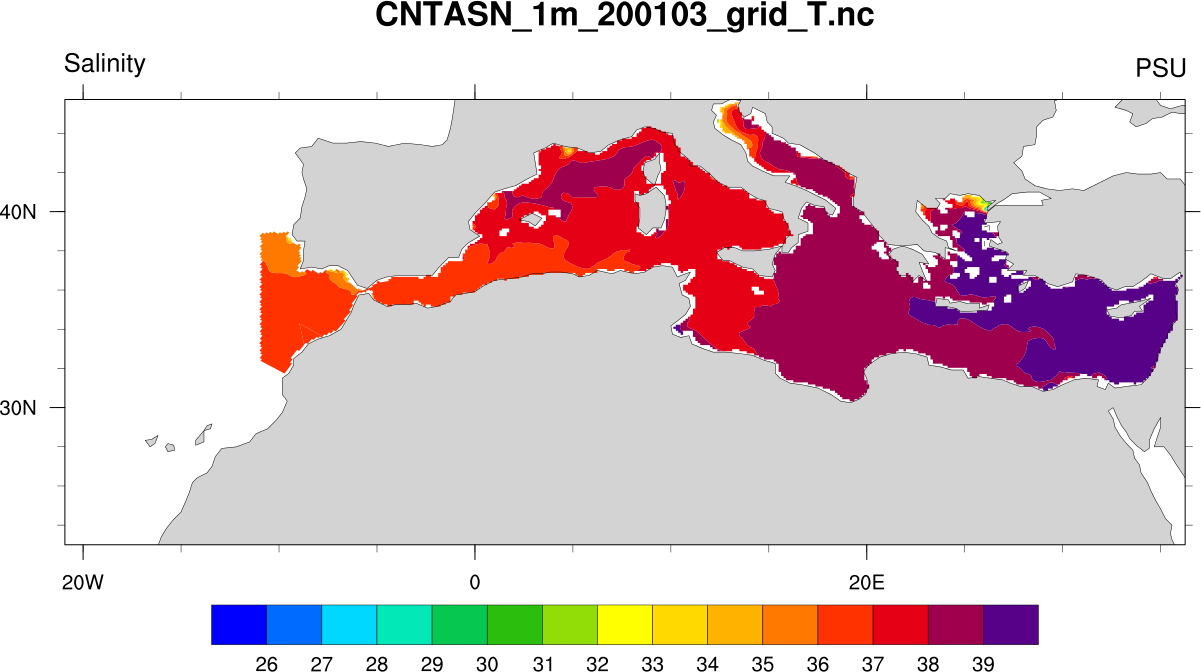
| CNTASN_vosaline_5.ncl
| CNTASN_vosaline_6.ncl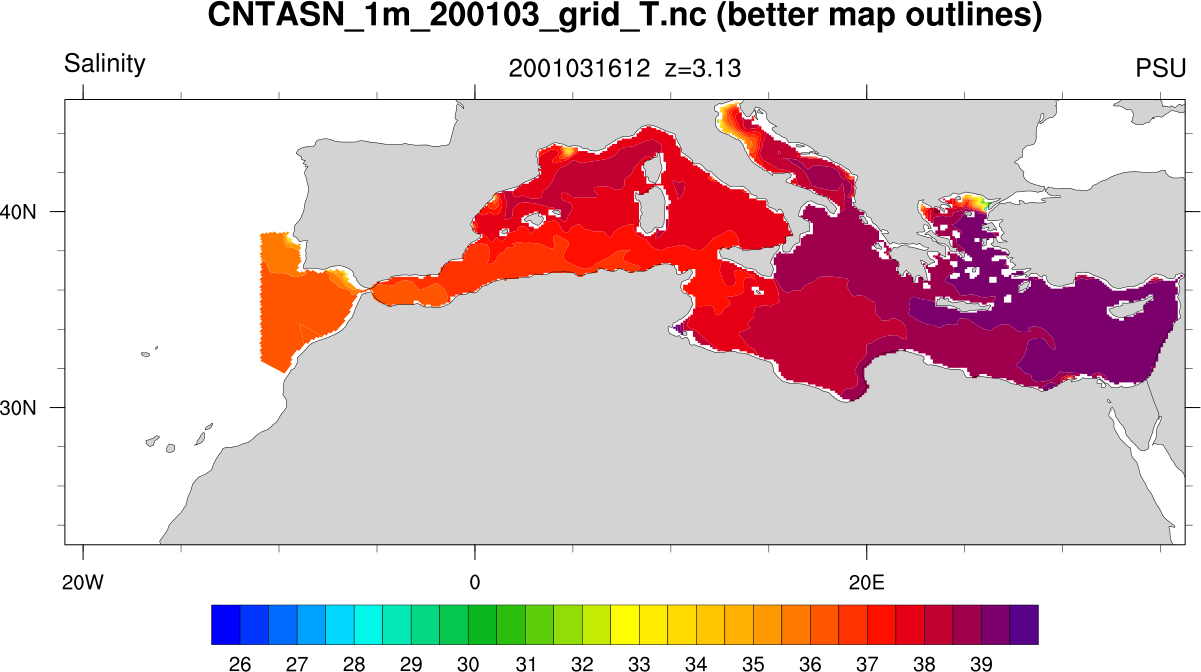
|
CNTASN_vosaline_7.ncl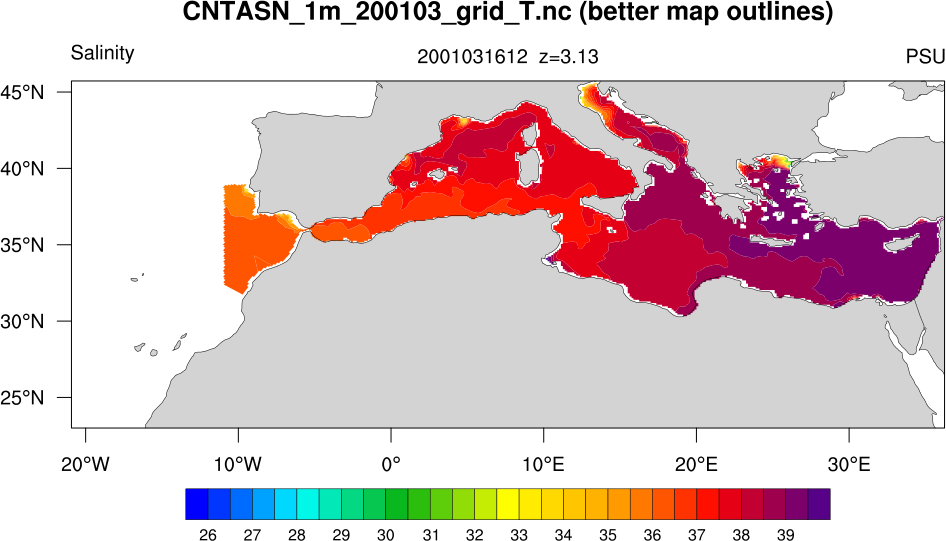
| CNTASN_vosaline_8.ncl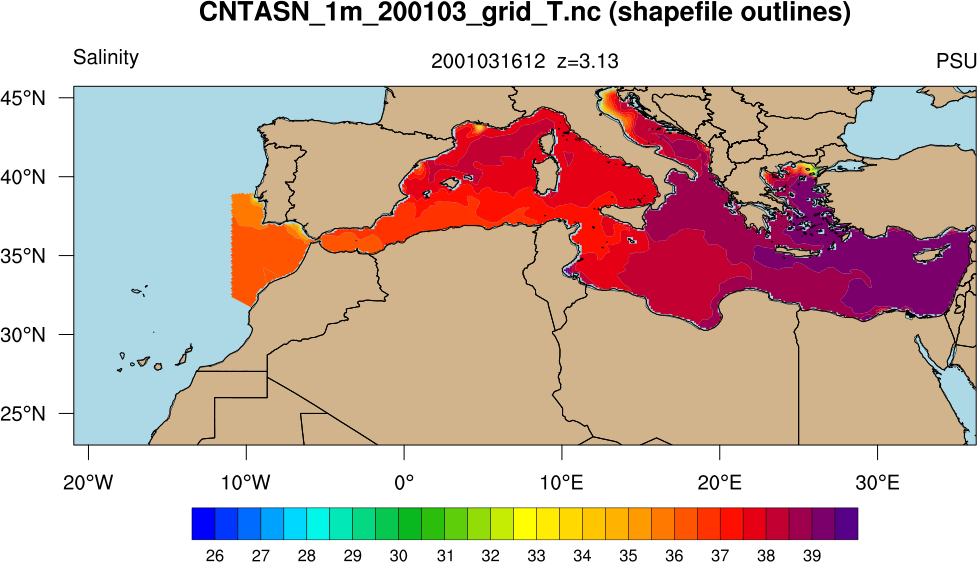
| CNTASN_temper.ncl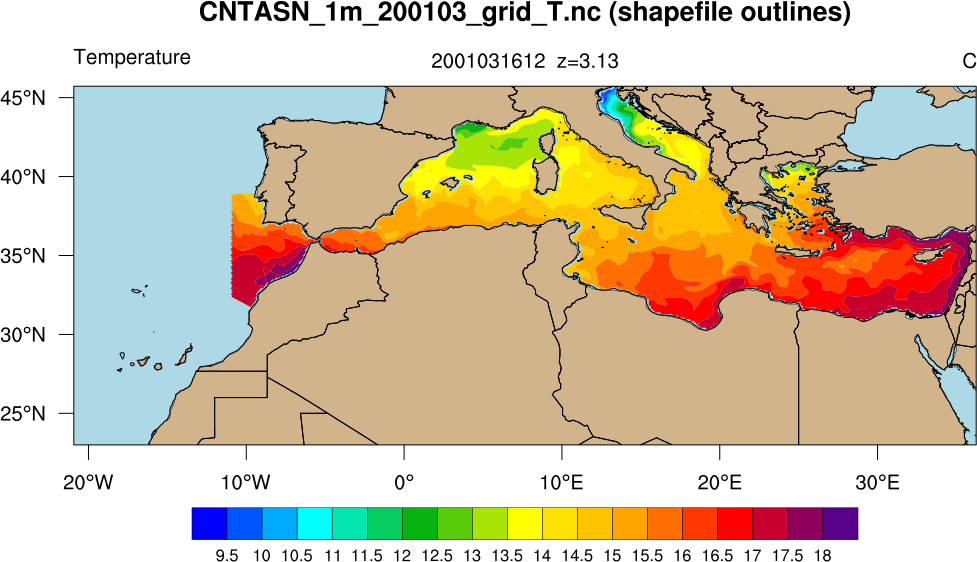
|
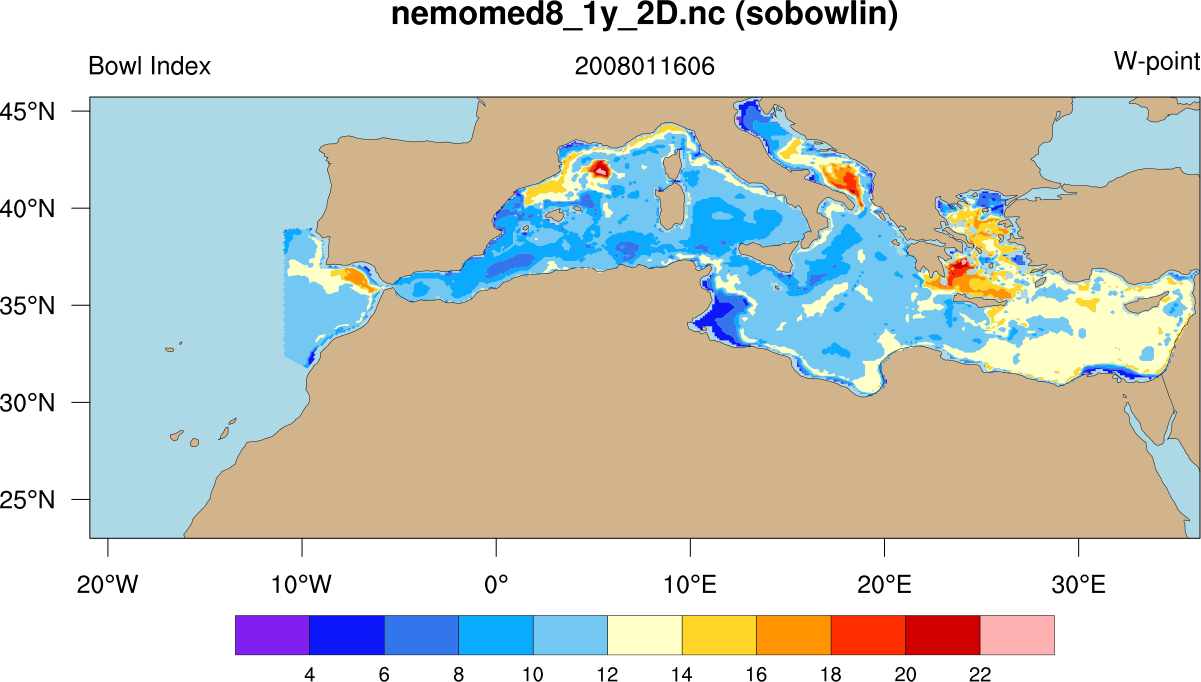
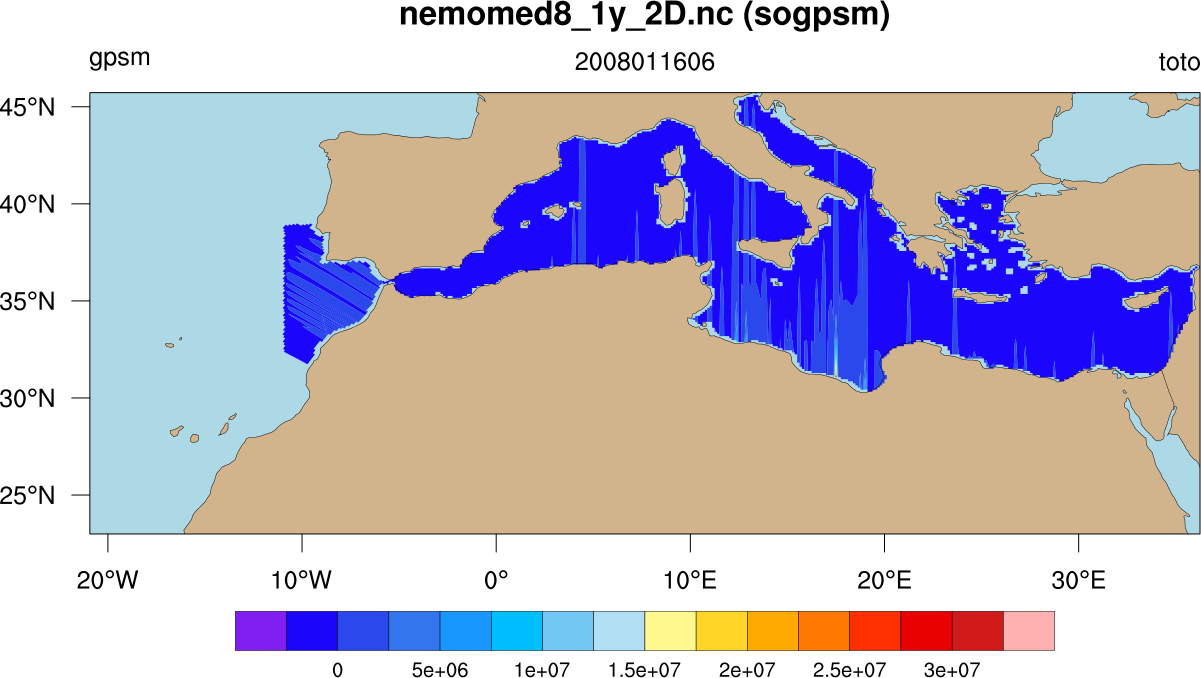
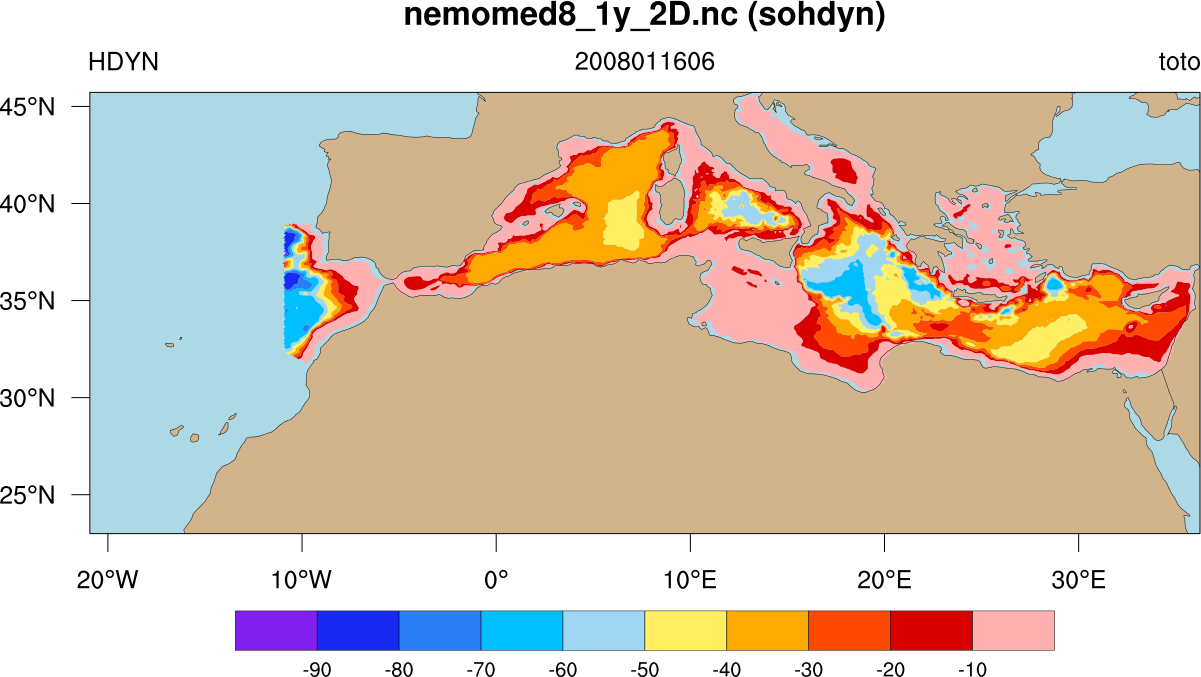
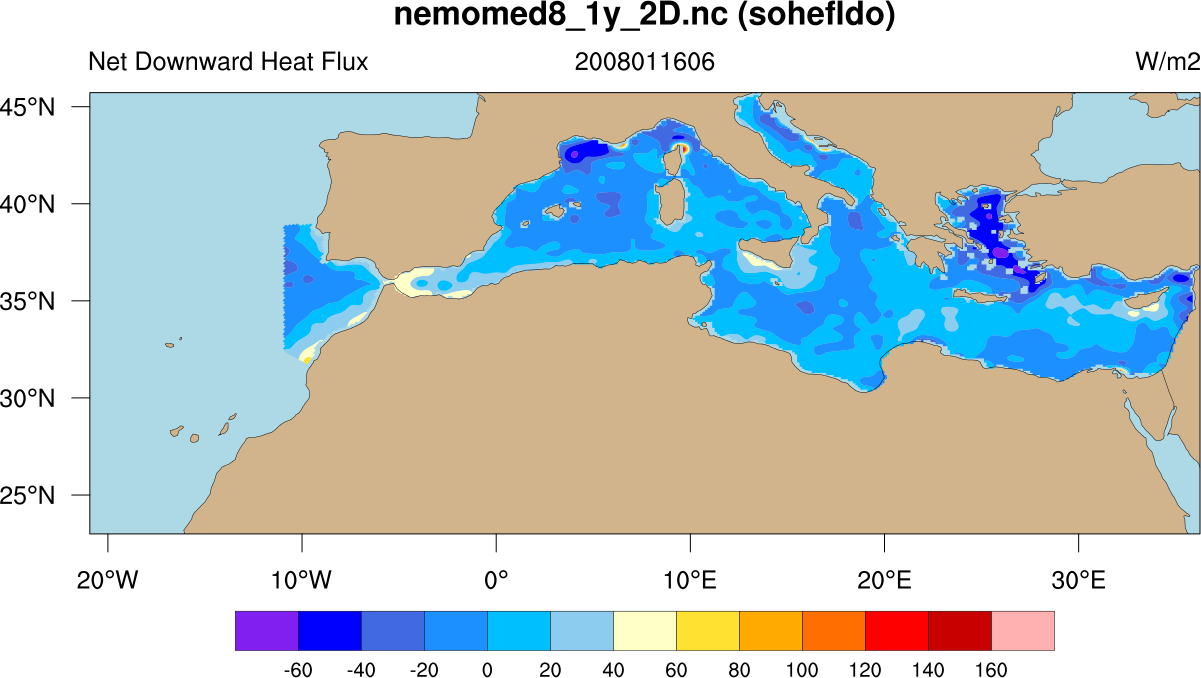
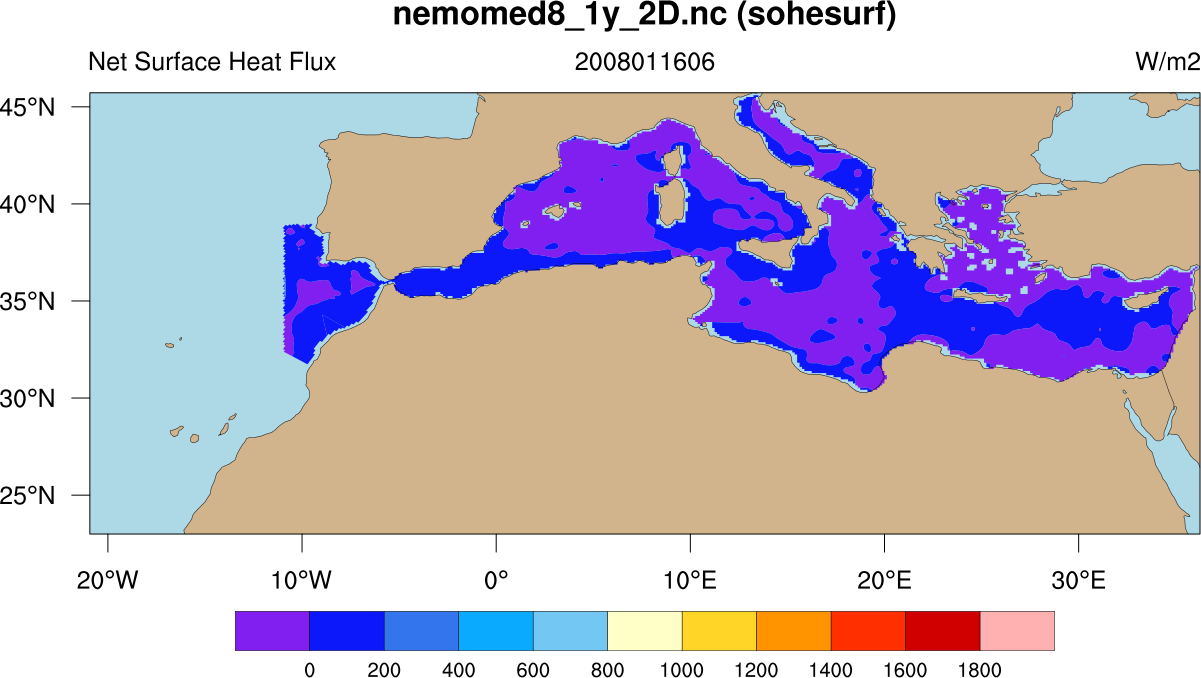
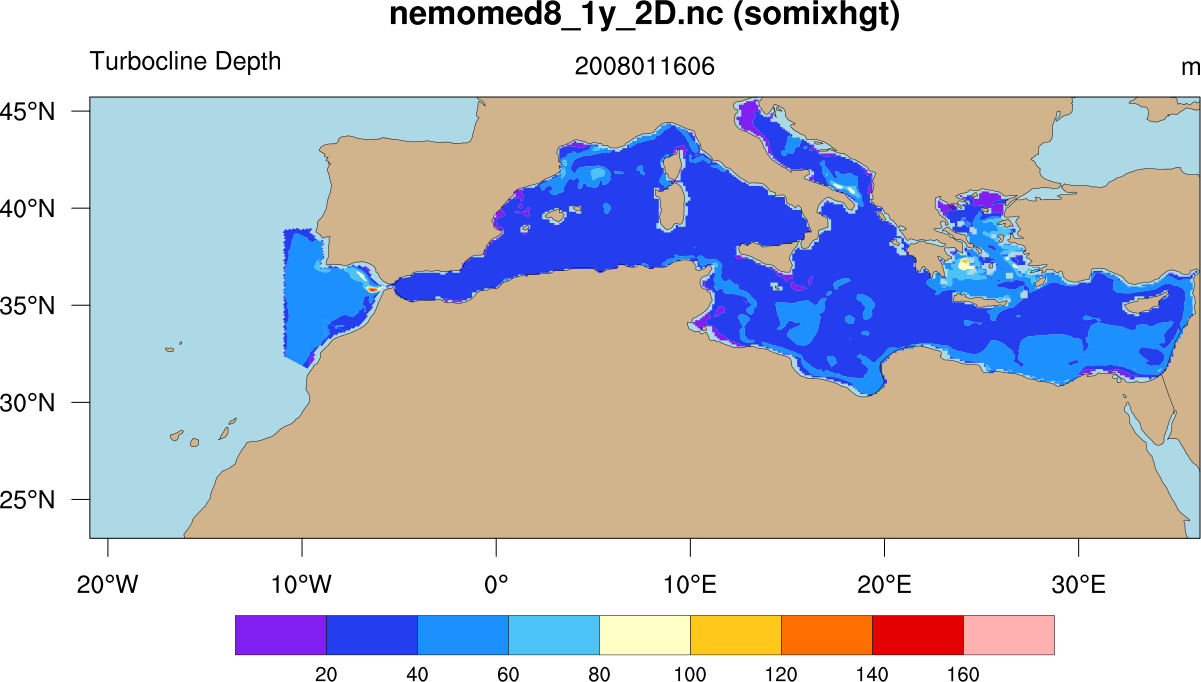
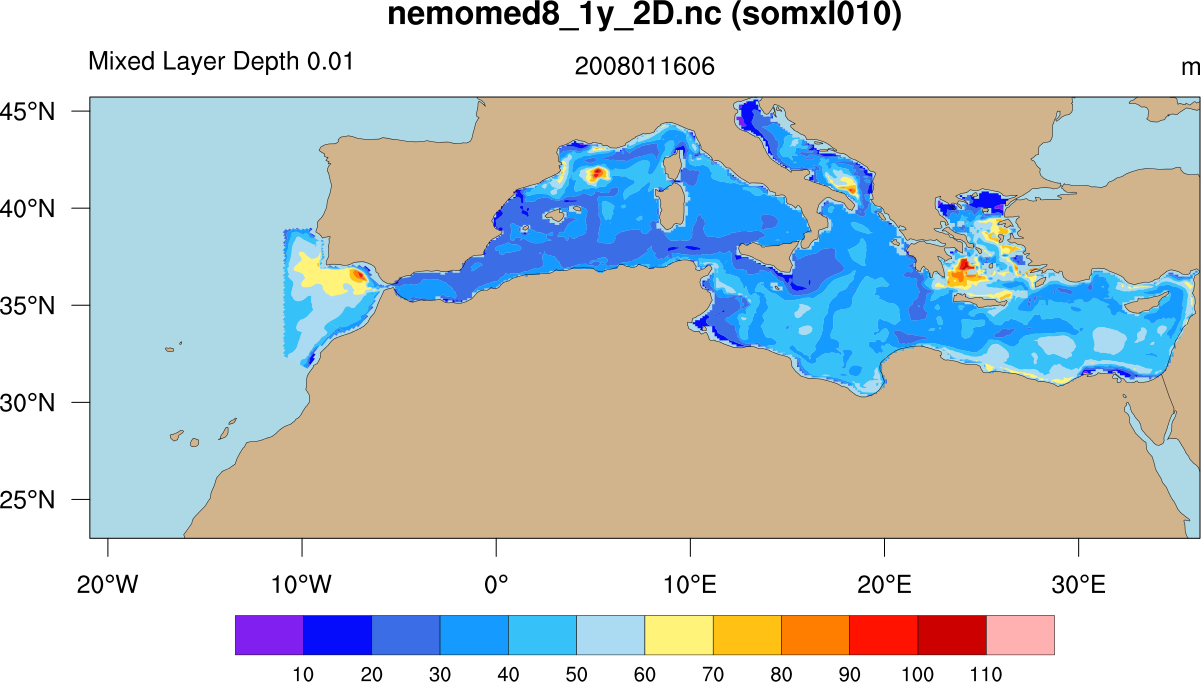
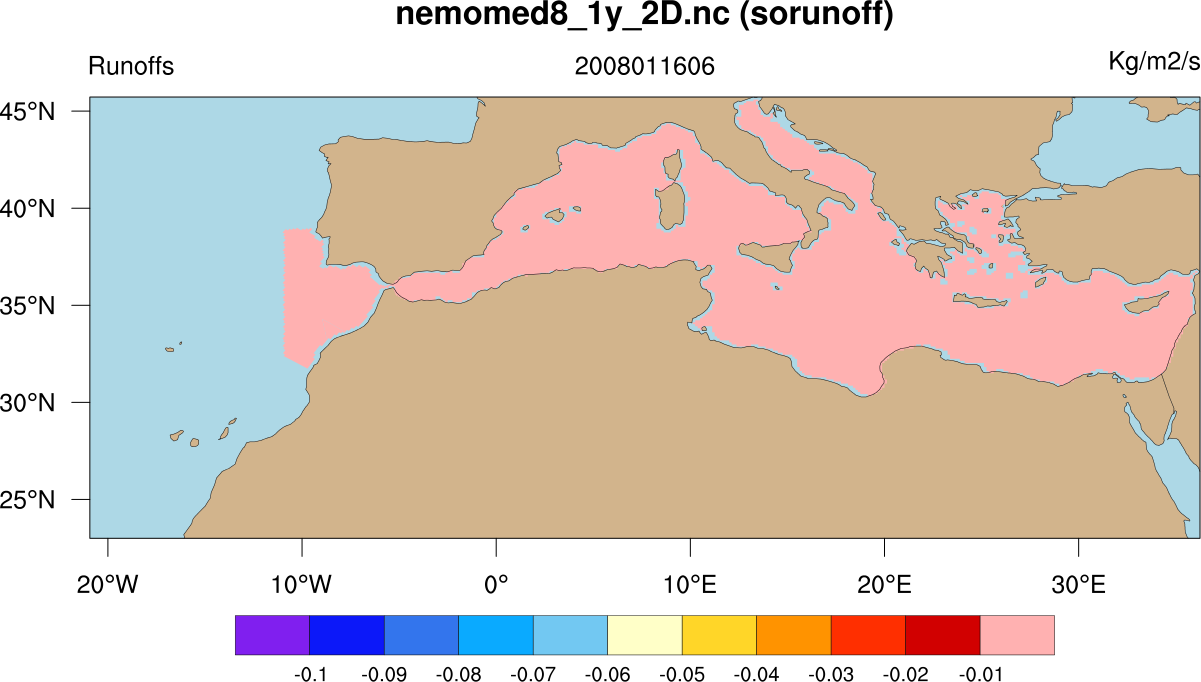
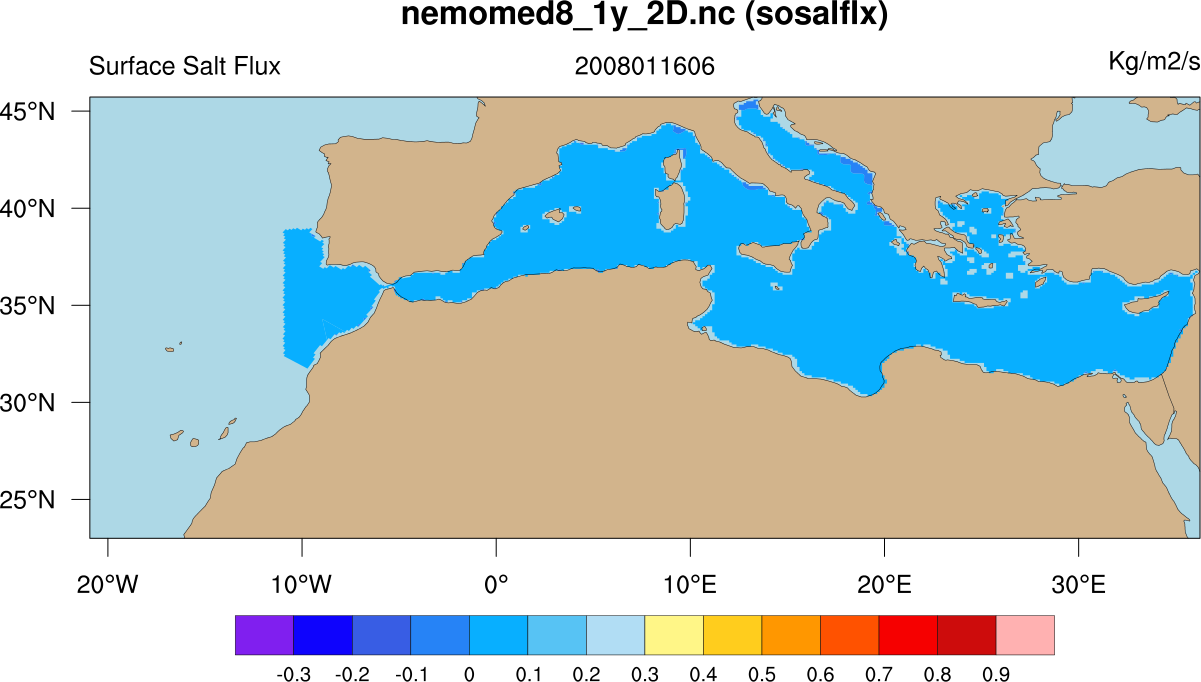
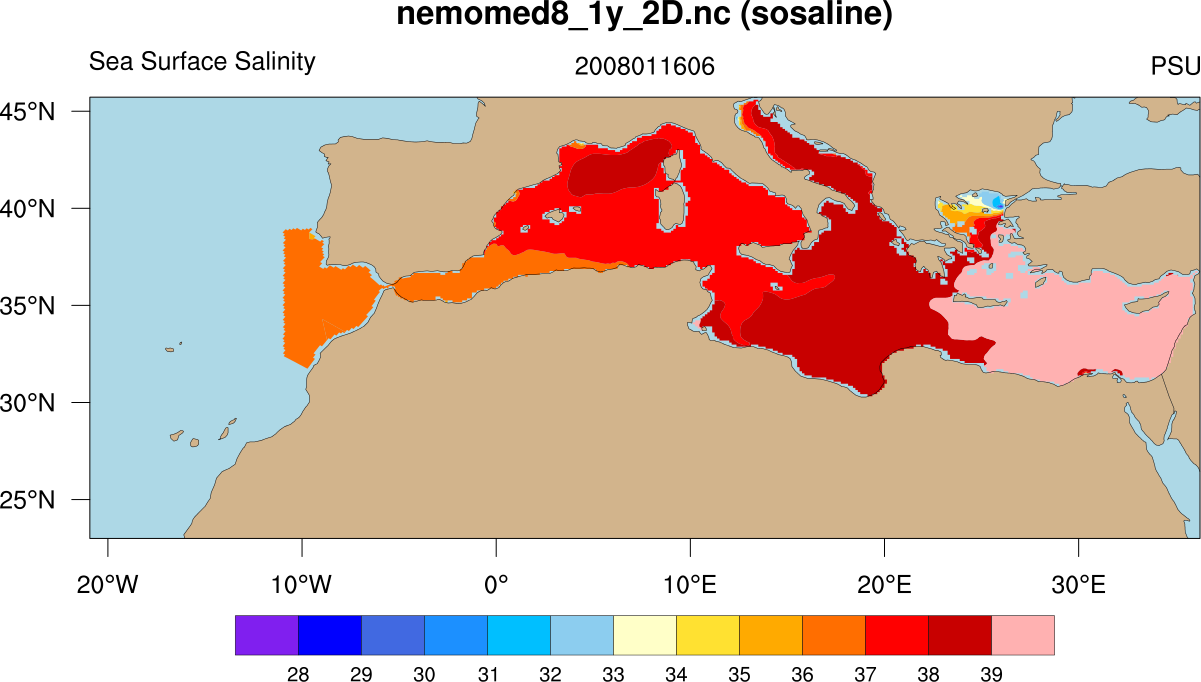
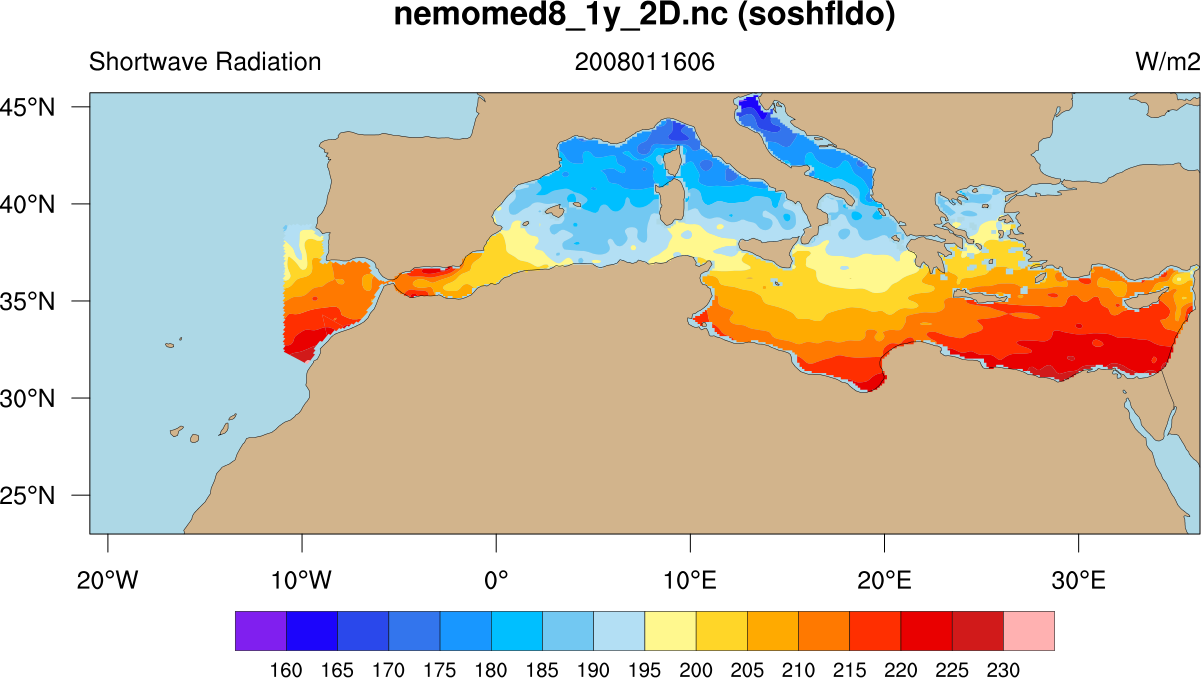
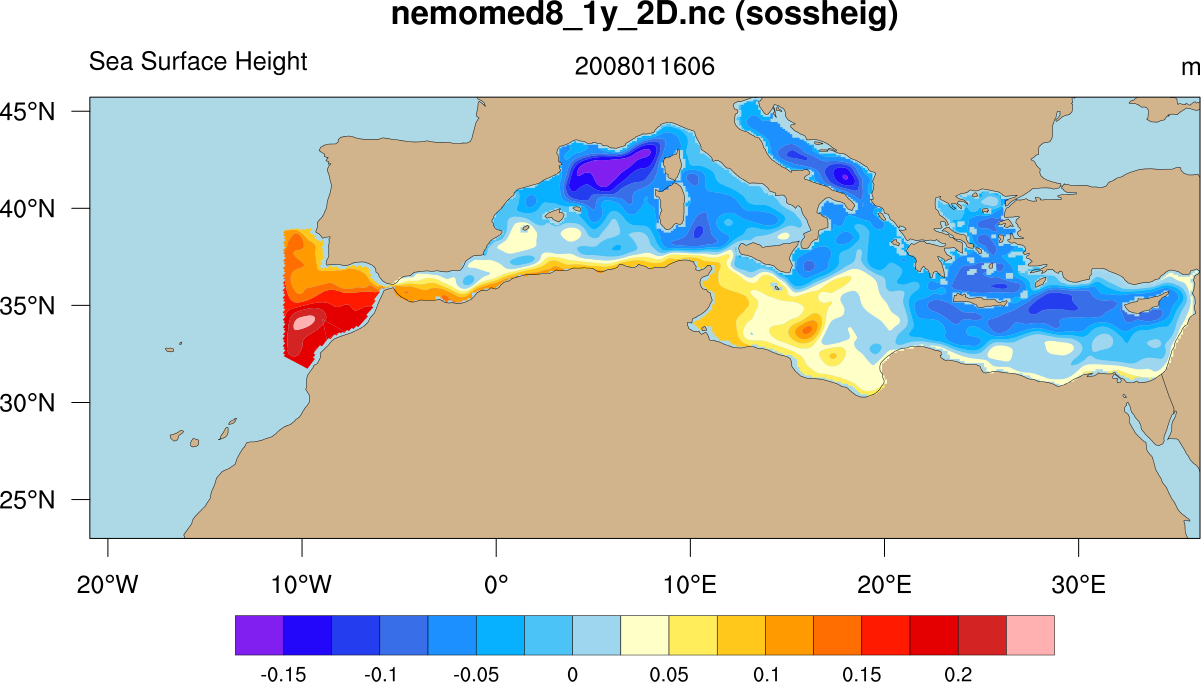
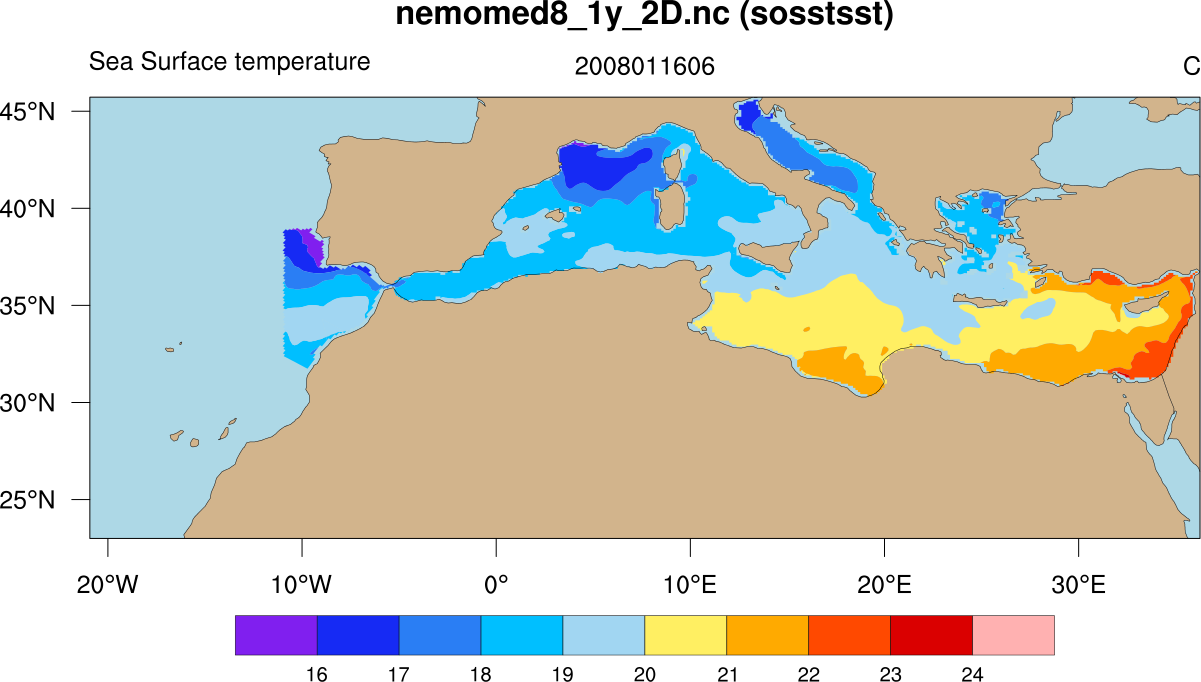
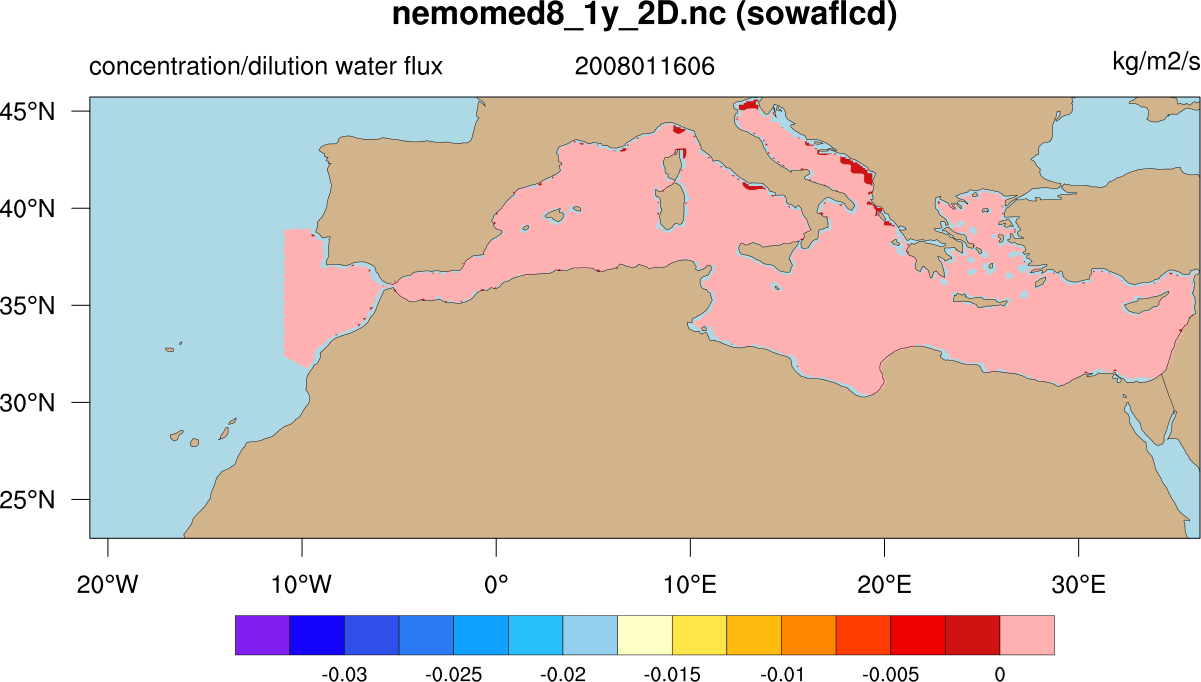
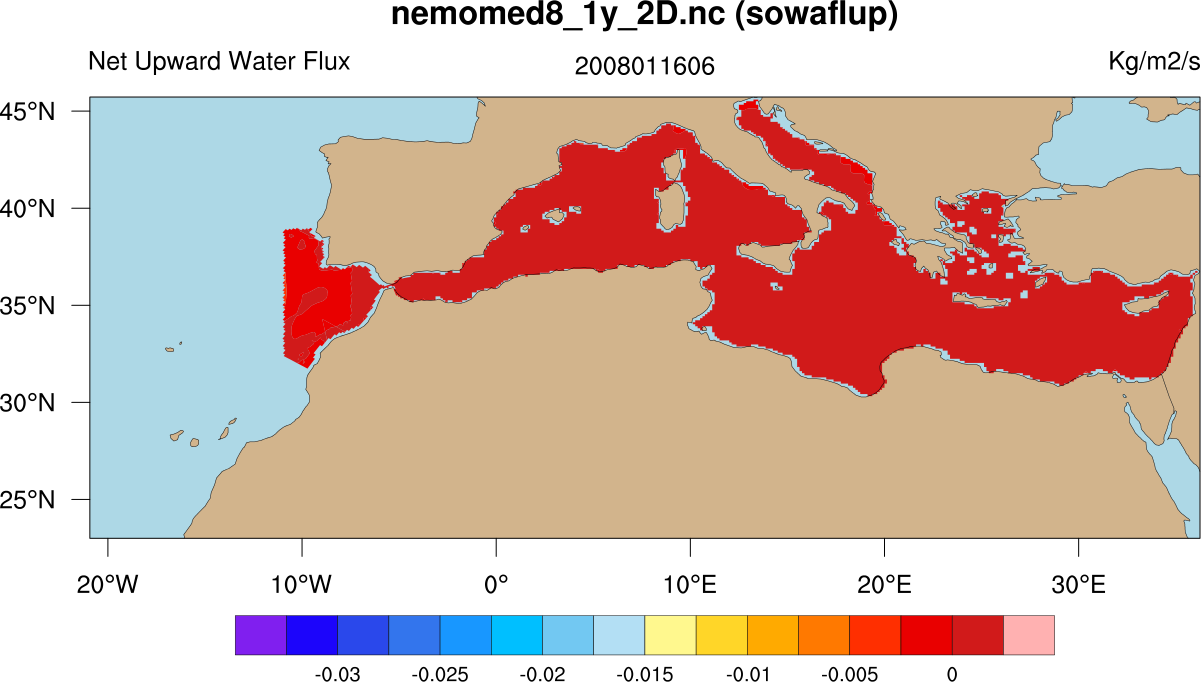
| The file used for these plot is "nemomed8_1y_2D.nc",
provided by Florence Sevault, Météo-France. It is
similar to CNTASN_temper.ncl above.
The _FillValue value had to be "fixed" because the data values that were missing were not exactly equal to the value equal to _FillValue.
| ||
NEMO_temp.ncl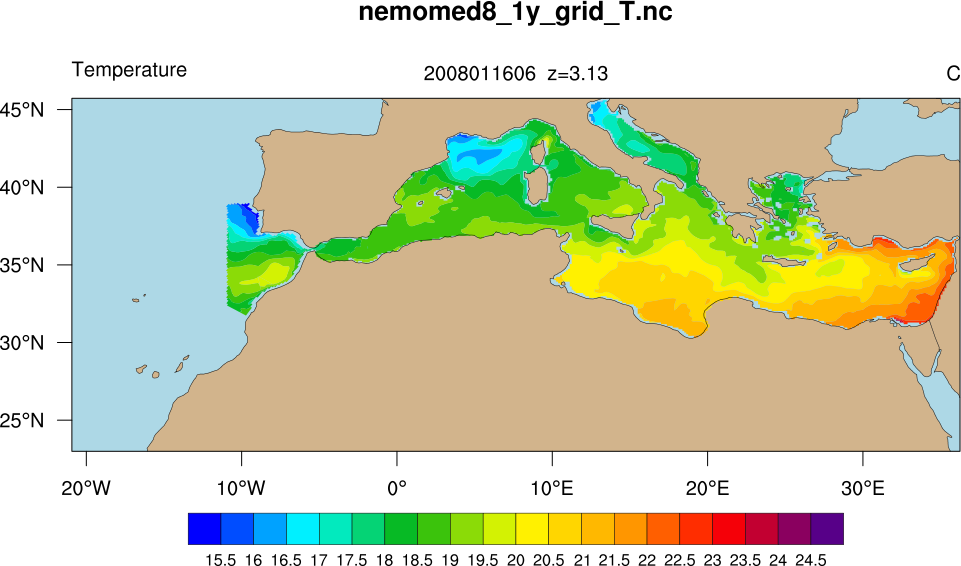
| NEMO_ssl.ncl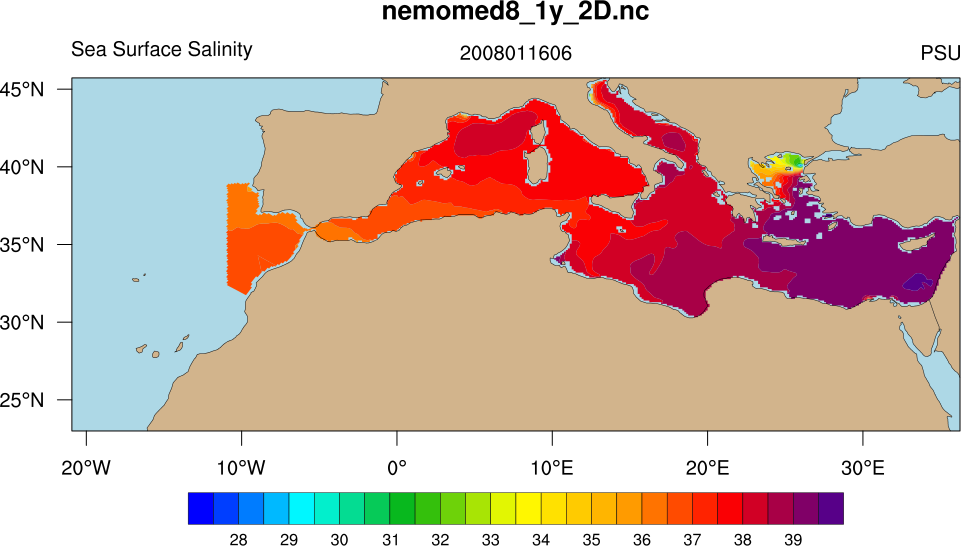
| NEMO_sst.ncl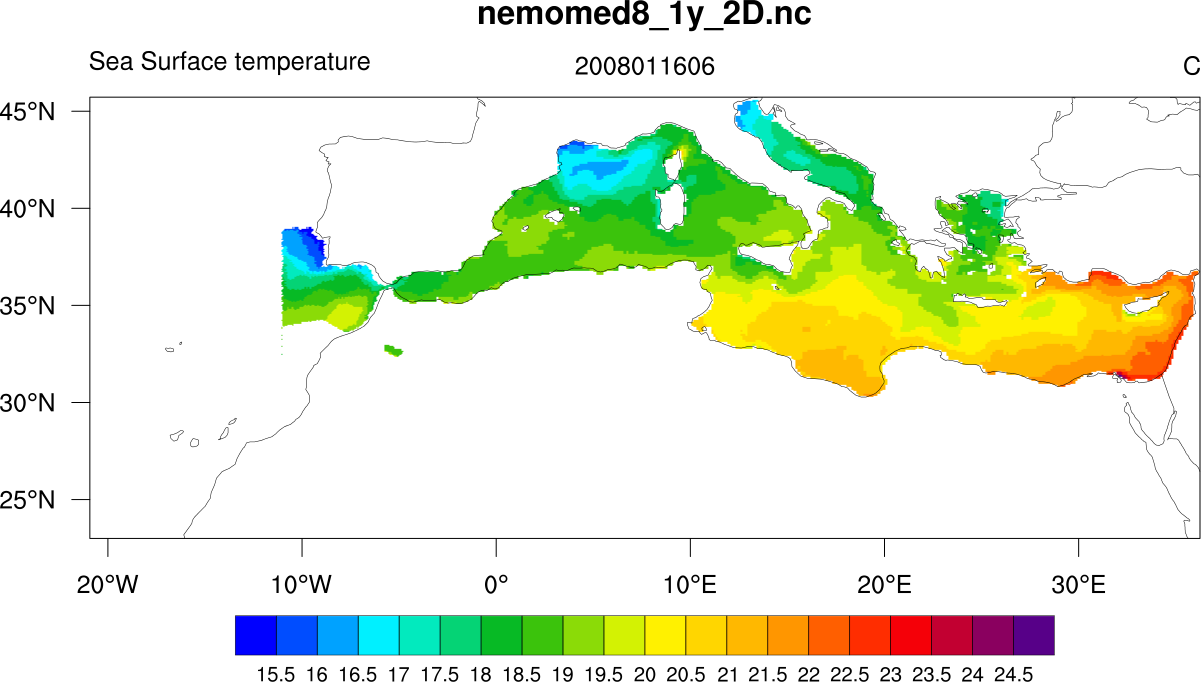
|
| To plot every variable on the "nemomed8_1y_2D.nc", use this NEMO_plot_all.ncl script. | ||
| 
| 
|
| 
| 
|
| 
| 
|
| 
| 
|

| 
| 
|
| ||