exponential_curve_fit
Calculates the coefficients for a simple exponential curve fit of the form ' y = A*exp(B*x)' using least squares.
 Available in version 6.5.0 and later.
Prototype
load "$NCARG_ROOT/lib/ncarg/nclscripts/csm/contributed.ncl"  ; This library is automatically loaded
                                                             ; from NCL V6.2.0 onward.
                                                             ; No need for user to explicitly load.

	function exponential_curve_fit (
		x   [*] : numeric,
		y   [*] : numeric,
		dims    : integer,
		opt [1] : logical
	)

	return_val [2] :  float or double
Arguments
xy
One-dimensional arrays of the same length. Missing values should be indicated by x@_FillValue and y@_FillValue. If x@_FillValue or y@_FillValue are not set, then the NCL default (appropriate to the type of x and y) will be assumed.
dimsCurrently, this argument is ignored. Set to 0.
optCurrently, this argument is ignored. Set to False.
Return value
The return s a one-dimensional array of size 2. It will type double if x or y are double, and float otherwise.
Description
This follows the approach described by Eric Weisstein: Least Squares Fitting--Exponential: MathWorld--A Wolfram Web Resource
The functional form is: y = A*exp(B*x)
This MathWorld--A Wolfram Web Resource also provides least squares descriptions for fitting logarithmic and power-law curves.
See Also
regline, regline_stats, regCoef, regCoef_n, reg_multlin_stats,
Examples
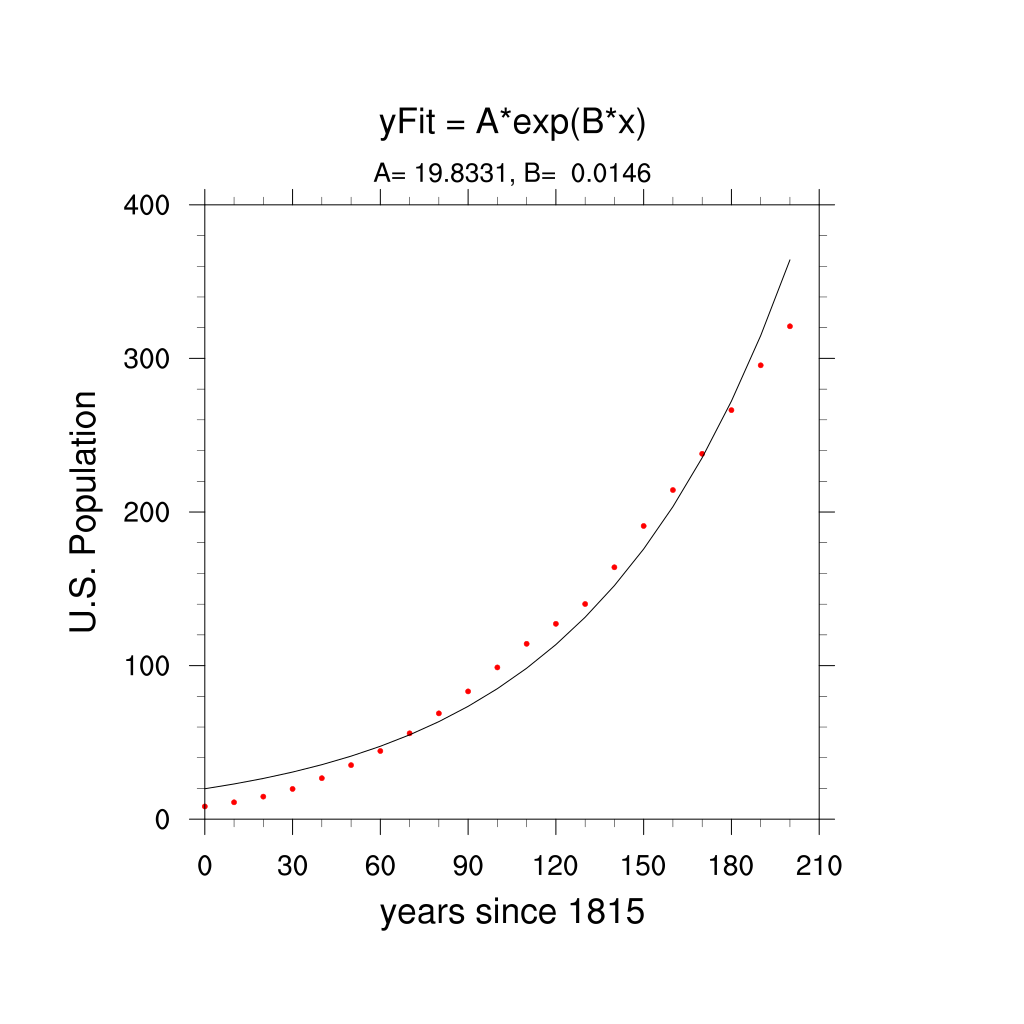
Example 1: The plot created by the following code is available here.
;--------------------------------------------------------------
; Test data (1815-1975): https://mste.illinois.edu/malcz/ExpFit/data.html
; Test data (1985-2015): http://www.multpl.com/united-states-population/table
;--------------------------------------------------------------
  y       = (/  8.3, 11.0, 14.7, 19.7,  26.7, 35.2, 44.4, 55.9, 68.9 \
             , 83.2, 98.8, 114.2,127.2,140.1,164.0,190.9,214.3       \
             ,237.9,266.3, 295.5,320.9 /)       ; added 1985-2015
  y@long_name = "U.S. Population"
  y@units     = "millions"

  yrStrt = 1815
  yrLast = 2015
  yrJump = 10

  time   = ispan(yrStrt, yrLast, yrJump) - yrStrt
  time@long_name = "years since "+yrStrt

;---Exponential fit

  dims  = 0
  efit  = exponential_curve_fit(time, y, dims, False)     ; efit(2)
  A     = efit(0)                                         ; extract for clarity
  B     = efit(1)

;---Generate curve using returned coefficients

  yfit  = A*exp(B*time)

;**********************************************
;---PLOT
;**********************************************

;---Create array to be plotted
  nxy       = dimsizes(y)
  data      = new ( (/2,nxy/), typeof(y))
  data(0,:) = y
  data(1,:) = yfit

;---Graphics
  pltType = "png"
  wks     = gsn_open_wks(pltType, "curve_exp_fit")

  if (pltType.eq."x11" .or. pltType.eq."png") then
      pltType@wkWidth  = 800      ; Set the pixel size of PNG/X11 image.
      pltType@wkHeight = 800
  else

  res                     = True                   ; plot mods desired
  if (pltType.eq."ps" .or. pltType.eq."eps" .or. pltType.eq."pdf") then
      res@gsnMaximize     = True                   ; ps, pdf otherwise no effect
  end if
  res@xyMarkLineModes     = (/"Markers","Lines"/)  ; raw values; line fit
  res@xyMarkers           = 16                     ; choose type of marker
  res@xyMarkerColor       = "red"                  ; Marker color
  res@xyMarkerSizeF       = 0.005                  ; Marker size (default 0.01)
  res@xyDashPatterns      = 1                      ; solid line
  res@xyLineThicknesses   = (/1,2/)                ; set second line to 2

  res@tiMainString        = "yFit = A*exp(B*x)"    ; title
  res@gsnCenterString     = "A="+sprintf("%8.4f",efit(0))+", B="+sprintf("%8.4f",efit(1))
  plot  = gsn_csm_xy (wks,time,data,res)           ; create plot