NCL > Application examples > Basic examples
XyPlot examples
This module is a graphical index to the HLU and NCL NCAR Graphics examples that generate X-Y plots. Click on one of the example graphics below to link to information about how to create the graphic and how to access the data and code that was used to generate the plot.
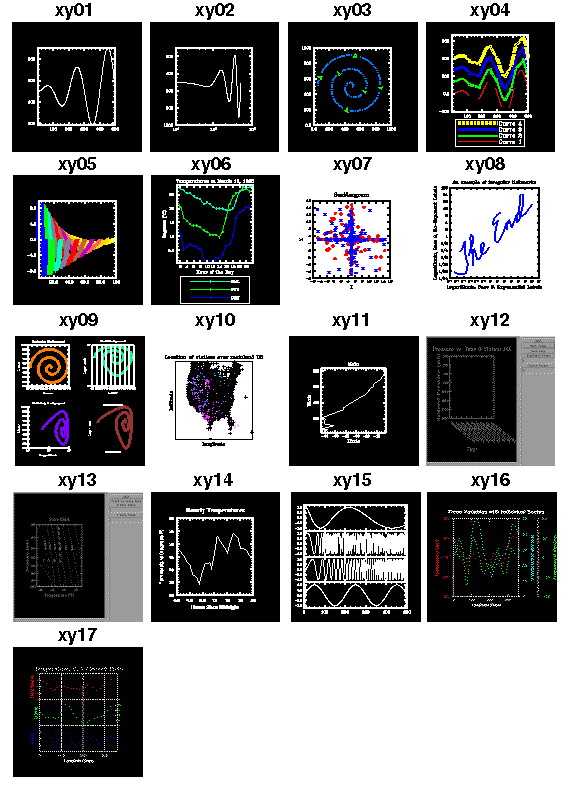
- xy01: How to create an XyPlot using
default settings.
- xy02: How to set XyPlot resources using a
resource file.
- xy03: How to set resources and axis
coordinates.
- xy04: How to create an XyPlot with
multiple lines.
- xy05: How to create an XyPlot with
multiple lines using a CoordArrTable object.
- xy06: Using multiple lines, external data,
and legends.
- xy07: Creating a scattergram.
- xy08: Using irregular points to set a plot
transformation.
- xy09: Setting axis styles.
- xy10: Overlaying an XyPlot on a MapPlot.
- xy11: How to draw an XyPlot in an X Window
and in an NCGM file.
- xy12: How to incorporate the HLU library
with your own X interface.
- xy13: How to interactively retrieve
coordinate locations from a plot.
- xy14: How to manipulate XyPlot data
using NCL.
- xy15: Creating 'stacked' plots using the
annotation feature.
- xy16: How to draw an XyPlot with three different
axes.
- xy17: How to draw stacked XyPlots sharing
the same X axes.