NCL is updated continually to include new tables. In addition, users may input their own parameter tables, if desired.
You can also use NCL to learn more about a grib file: grib_read.txt
Example pages containing:
tips |
resources |
functions/procedures

NCL is updated continually to include new tables. In addition, users may input their own parameter tables, if desired.
You can also use NCL to learn more about a grib file: grib_read.txt
 era40_1.ncl:
A simple color plot from an grib file.
era40_1.ncl:
A simple color plot from an grib file.
gsn_csm_contour_map is the plot interface that, by default, creates a cylindrical equidistant plot.
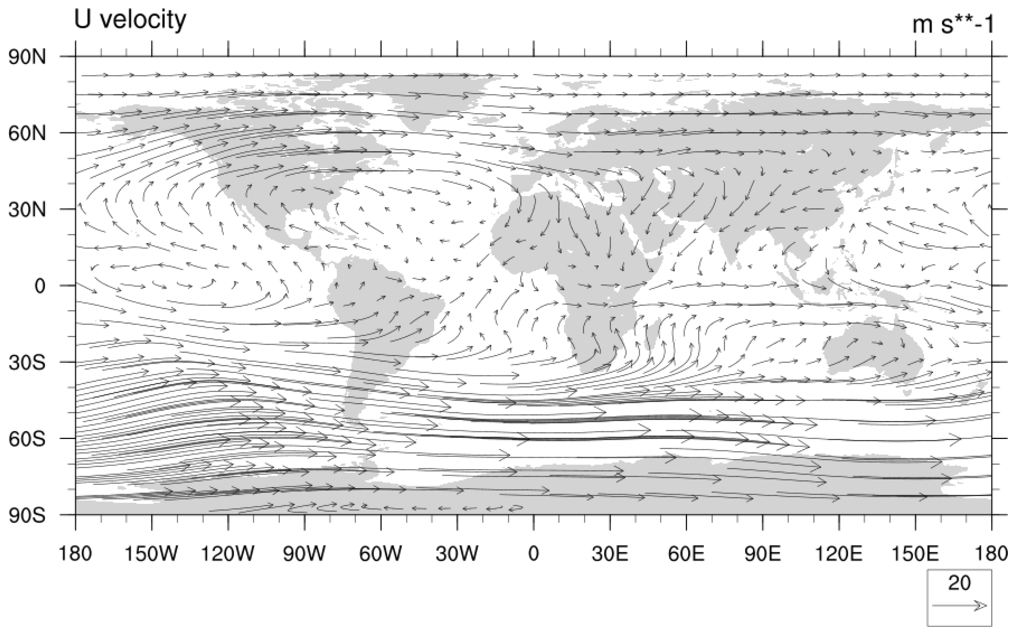 era40_2.ncl:
A simple vector plot.
era40_2.ncl:
A simple vector plot.
gsn_csm_vector_map_ce is the plot interface that draws vectors over a cylindrical equidistant map.
Learn more about how to plot vectors at the vector example page
e20c_1.ncl:
A sample E20C file with variable 'Cloud Cover'. Same as all other ERA GRIB files.
gsn_csm_contour_map is the plot interface that, by default, creates a cylindrical equidistant plot.
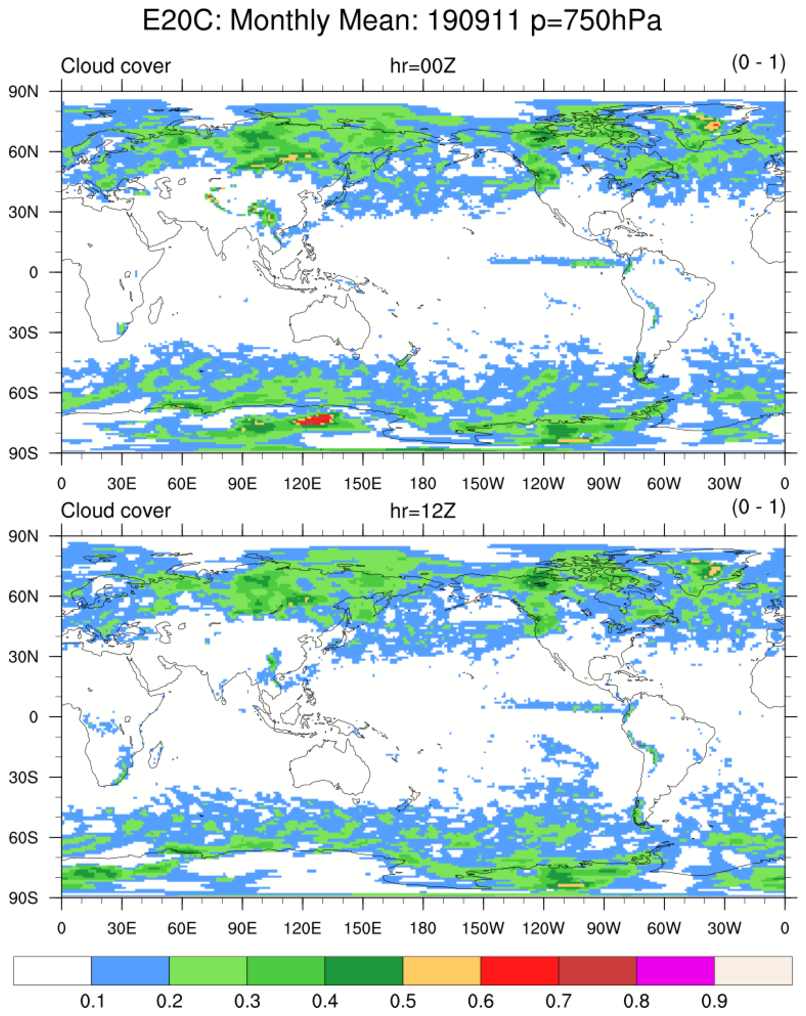
 e20c_2.ncl:
Compute the monthly means at 00Z, 12Z at 750hPa and the overall monthly mean at 500hPa.
The cd_calendar function is used to create time information in different forms;
the ind function is used to determine the index vlues associated at different hours;
the dim_avg_n_Wrap calculate the means and retains all meta data.
e20c_2.ncl:
Compute the monthly means at 00Z, 12Z at 750hPa and the overall monthly mean at 500hPa.
The cd_calendar function is used to create time information in different forms;
the ind function is used to determine the index vlues associated at different hours;
the dim_avg_n_Wrap calculate the means and retains all meta data.