NCL Home>
Application examples>
gsn_csm graphical interfaces ||
Data files for some examples
 lat_time_1.ncl:
Creates default black and white latitude vs. time plot and
demonstrates the action of the NCL function
smth9.
lat_time_1.ncl:
Creates default black and white latitude vs. time plot and
demonstrates the action of the NCL function
smth9.
 lat_time_4.ncl: Demonstrates
default latitudinal spacing, and a function that increases it to
90 degrees.
lat_time_4.ncl: Demonstrates
default latitudinal spacing, and a function that increases it to
90 degrees.
Example pages containing:
tips |
resources |
functions/procedures
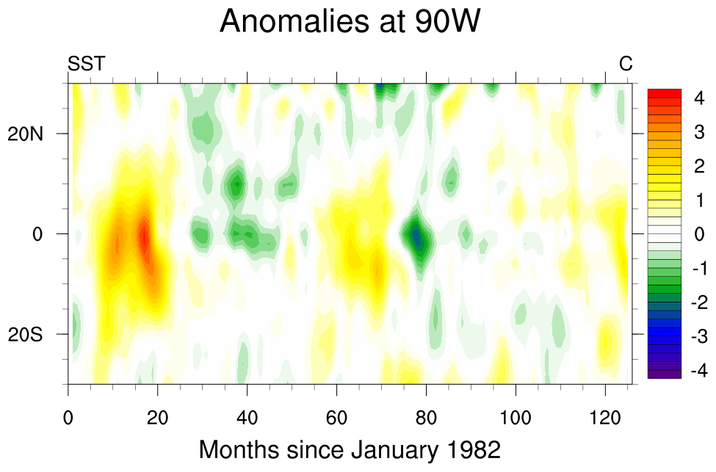
NCL Graphics: latitude vs. time (high-level plot interface)
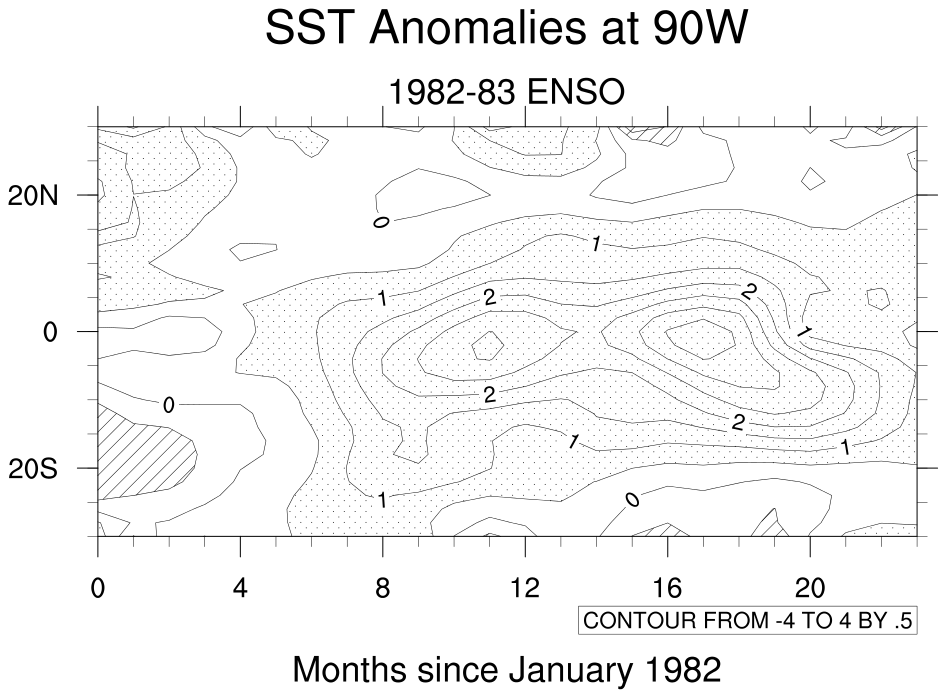
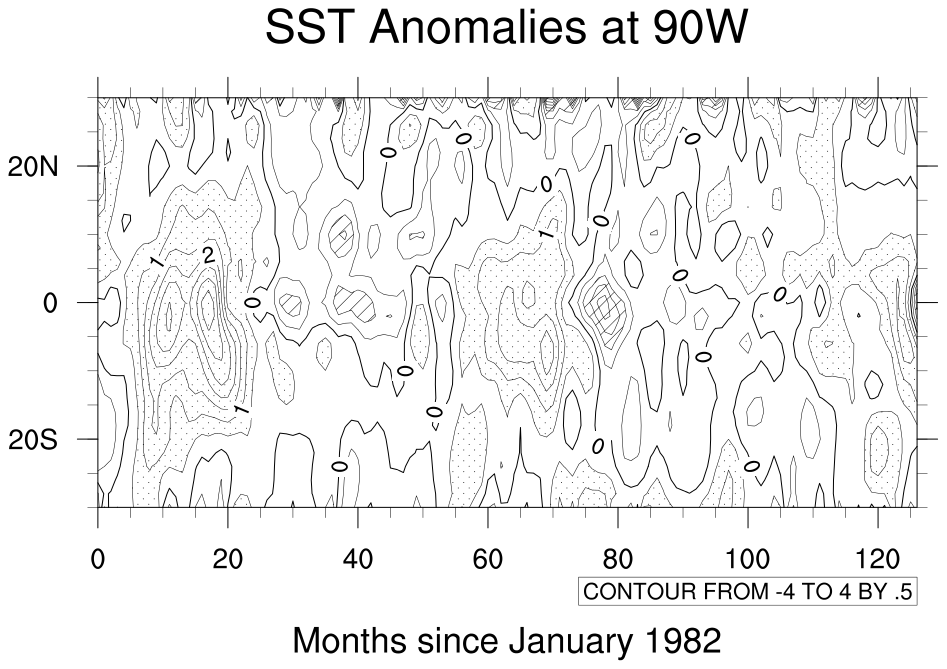 lat_time_1.ncl:
Creates default black and white latitude vs. time plot and
demonstrates the action of the NCL function
smth9.
lat_time_1.ncl:
Creates default black and white latitude vs. time plot and
demonstrates the action of the NCL function
smth9.
Please note that this interface expects the data to be dimensioned as x(lat,time). This may require you to reorder your data.
gsn_csm_lat_time is the plot
interface that creates latitude v.s. time plots.
ShadeLtGtContour and gsnContourZeroLineThicknessF are the shea
utility functions that shade the regions and add a zero line
contour. Note: ShadeLtGtContour has been superceded by
the more versatile gsn_contour_shade.
We recommend you use this instead.
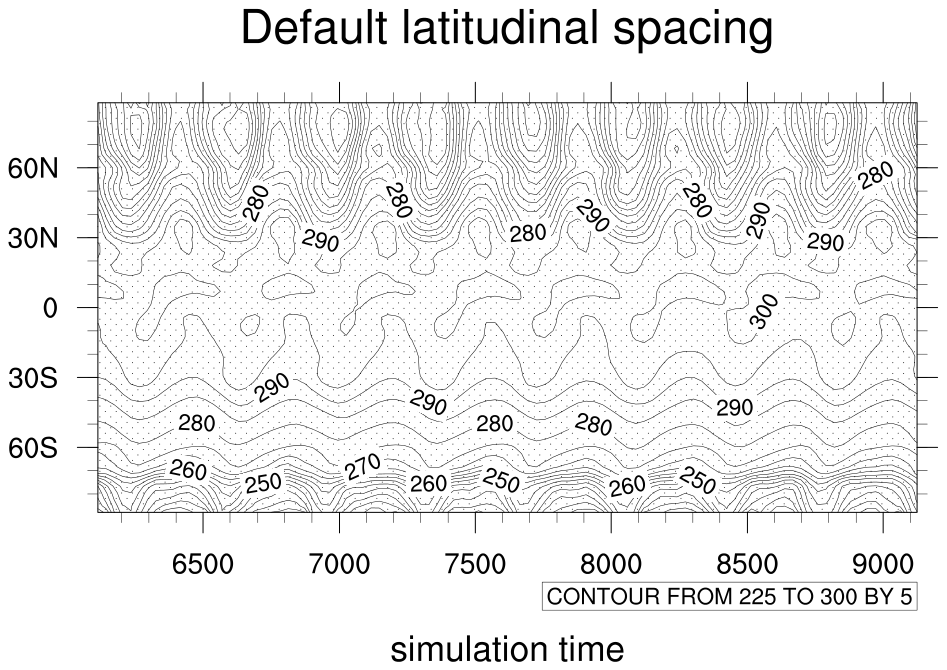
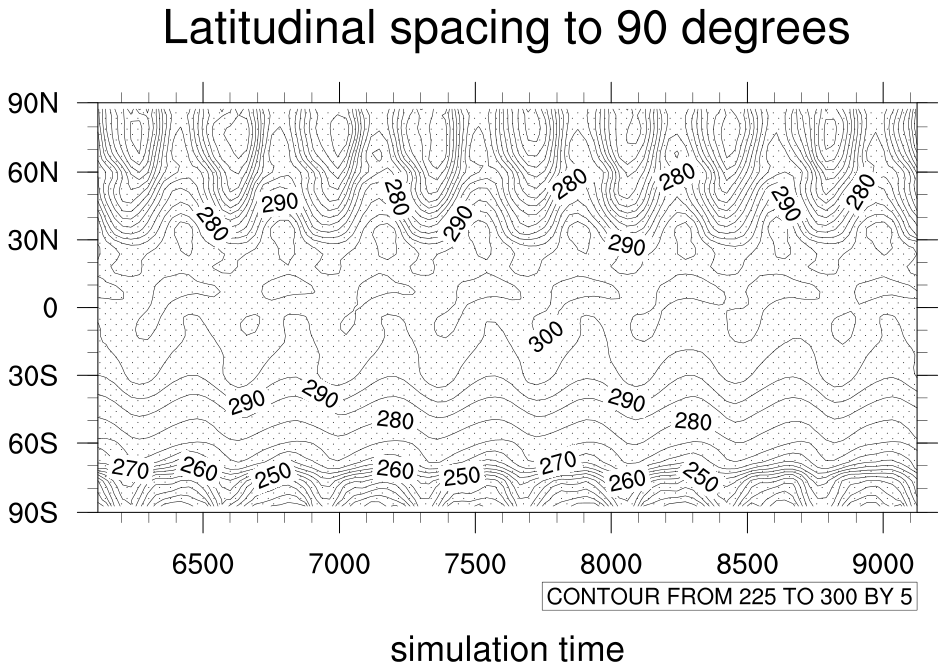 lat_time_4.ncl: Demonstrates
default latitudinal spacing, and a function that increases it to
90 degrees.
lat_time_4.ncl: Demonstrates
default latitudinal spacing, and a function that increases it to
90 degrees.
add90LatY is the function that extends the latitudinal labels to 90 degrees.