In addition to the examples on this page, we suggest you review the panel page, if your figure includes a panel plot.
NCL Home>
Application examples>
Plot techniques ||
Data files for some examples
 pub_1.ncl: This example demonstrates
how to compress a panel plot for publication purposes. In this case,
compress means remove the longitude labels and tickmarks from each of
the plots so they can be closer together. I have added a title to the
plot, but that may not be necessary if figure captions are used. See
example pub_2.ncl on how to add "a)" and "b)" figure strings to the panel plot.
pub_1.ncl: This example demonstrates
how to compress a panel plot for publication purposes. In this case,
compress means remove the longitude labels and tickmarks from each of
the plots so they can be closer together. I have added a title to the
plot, but that may not be necessary if figure captions are used. See
example pub_2.ncl on how to add "a)" and "b)" figure strings to the panel plot.
 pub_2.ncl: This is an example of
adding corner strings e.g. "a)", "b)" to plots in a panel.
pub_2.ncl: This is an example of
adding corner strings e.g. "a)", "b)" to plots in a panel.
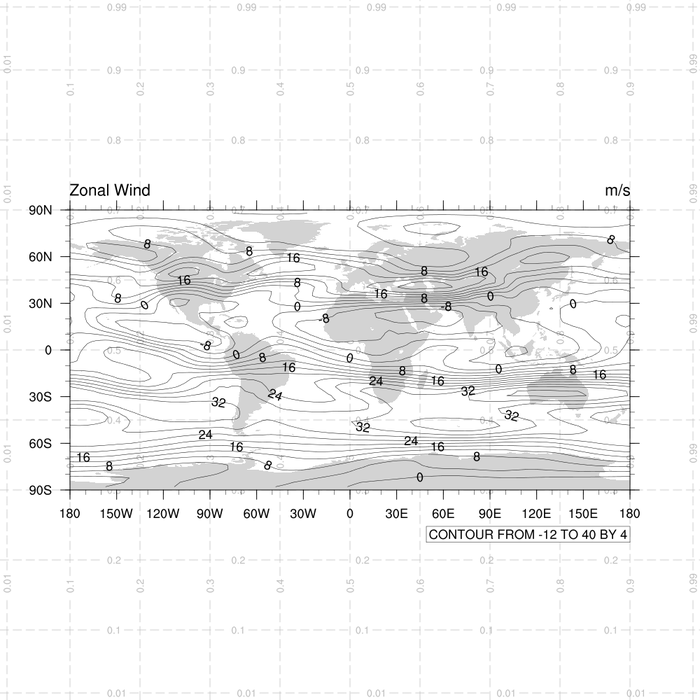
 pub_3.ncl: Demonstrates the use of the
function drawNDCGrid.
pub_3.ncl: Demonstrates the use of the
function drawNDCGrid.
Example pages containing: tips | resources | functions/procedures
NCL Graphics: Publication Layout Tricks
Whenever a graphic is submitted to a journal, the layout of the plot
is often different from the default presentation. For example, the
individual plots in a panel may have added text, or they may have
certain labels removed or moved in the interest of space.
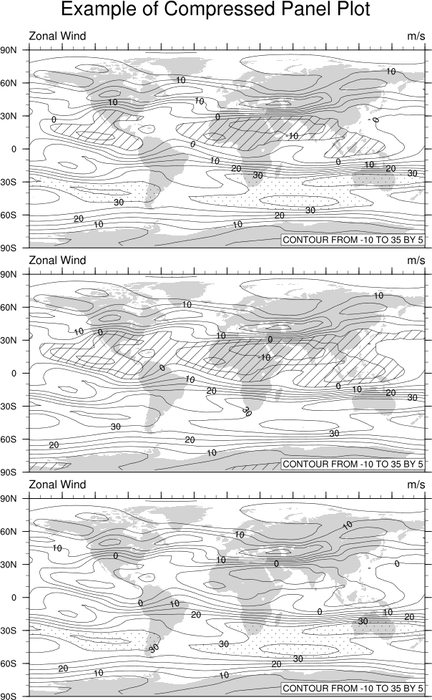 pub_1.ncl: This example demonstrates
how to compress a panel plot for publication purposes. In this case,
compress means remove the longitude labels and tickmarks from each of
the plots so they can be closer together. I have added a title to the
plot, but that may not be necessary if figure captions are used. See
example pub_2.ncl on how to add "a)" and "b)" figure strings to the panel plot.
pub_1.ncl: This example demonstrates
how to compress a panel plot for publication purposes. In this case,
compress means remove the longitude labels and tickmarks from each of
the plots so they can be closer together. I have added a title to the
plot, but that may not be necessary if figure captions are used. See
example pub_2.ncl on how to add "a)" and "b)" figure strings to the panel plot.
tmXBLabelsOn = False, and tmXBOn = False, turns off the bottom longitude lines and labels.
txString adds a common title to the panel plot.
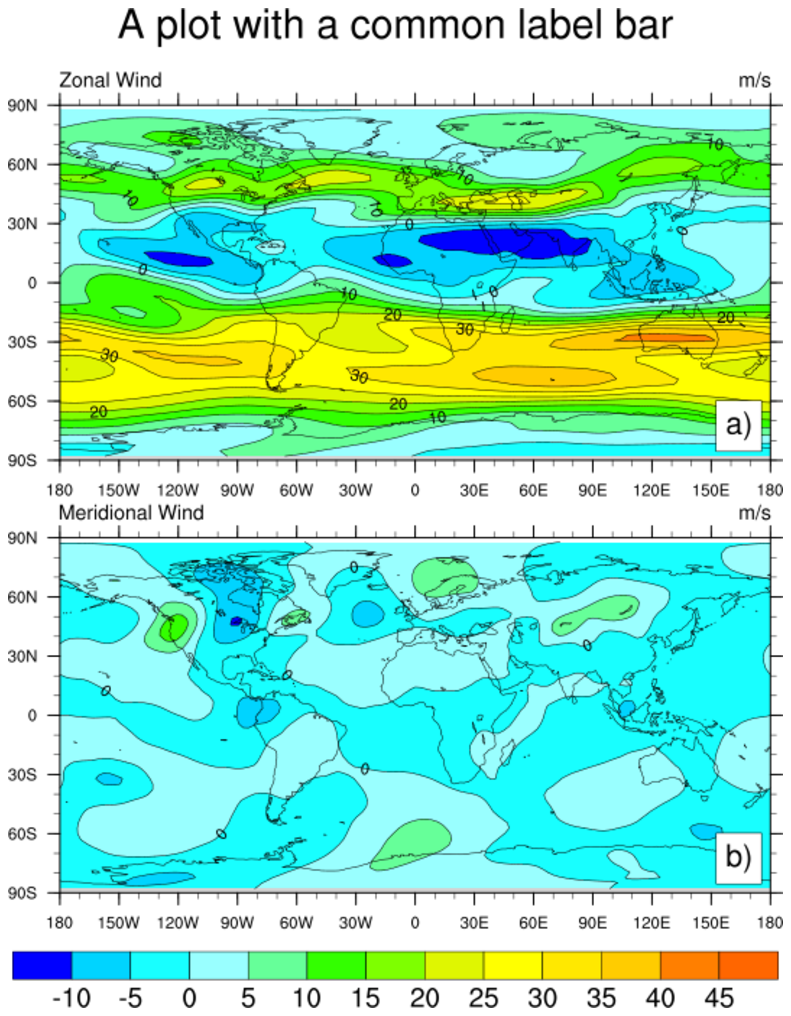 pub_2.ncl: This is an example of
adding corner strings e.g. "a)", "b)" to plots in a panel.
pub_2.ncl: This is an example of
adding corner strings e.g. "a)", "b)" to plots in a panel.
gsnPanelFigureStrings = (/"a)","b)"/), is the resource that will add a string to a corner in a panel plot. The default position is the bottom right-hand corner. To change the location, set "amJust" to one of the following:("TopRight", "TopLeft", or "BottomLeft").
The size of the figure strings is controlled by the gsnPanelFigureStringsFontHeightF resource.
 pub_3.ncl: Demonstrates the use of the
function drawNDCGrid.
pub_3.ncl: Demonstrates the use of the
function drawNDCGrid.
drawNDCGrid will create an NDC map on which you can draw your plots. This is useful for placing further text, polymarkers, polygons, and/or polylines in NDC coordinates gsn_text_ndc near the plot.