NCL Home>
Application examples>
Models ||
Data files for some examples
Example pages containing:
tips |
resources |
functions/procedures
NCL Graphics: Tripole Grids (ORCA, CICE)
Non-uniform grids and triangular mesh conversion
The ORCA grid used for many of the examples on this page is a non-uniform
grid. It was given to us by Christophe Cassou from the Centre National
de la Recherche Scientifique (CNRS/CERFACS) in Toulouse. This grid is
common in Europe, particularly in France; the IPSL centre ("Institut
Pierre-Simon Laplace model") developed it. More information on the
grid can be obtained here.
It is better to convert this grid to a triangular mesh rather than
interpolate it to a uniform grid before contouring. Note that only
contouring is available with triangular mesh conversion at this time.
If the input array to a gsn_csm graphical interface is one-
dimensional, and also has one-dimensional lat/lon arrays of the same
length, NCL automatically uses triangular mesh conversion. The lat/lon
information must be provided by setting sfXArray and sfYArray.
For more information on non-uniform grids that NCL can handle, see the
document "Non-uniform grids that
NCL can contour."
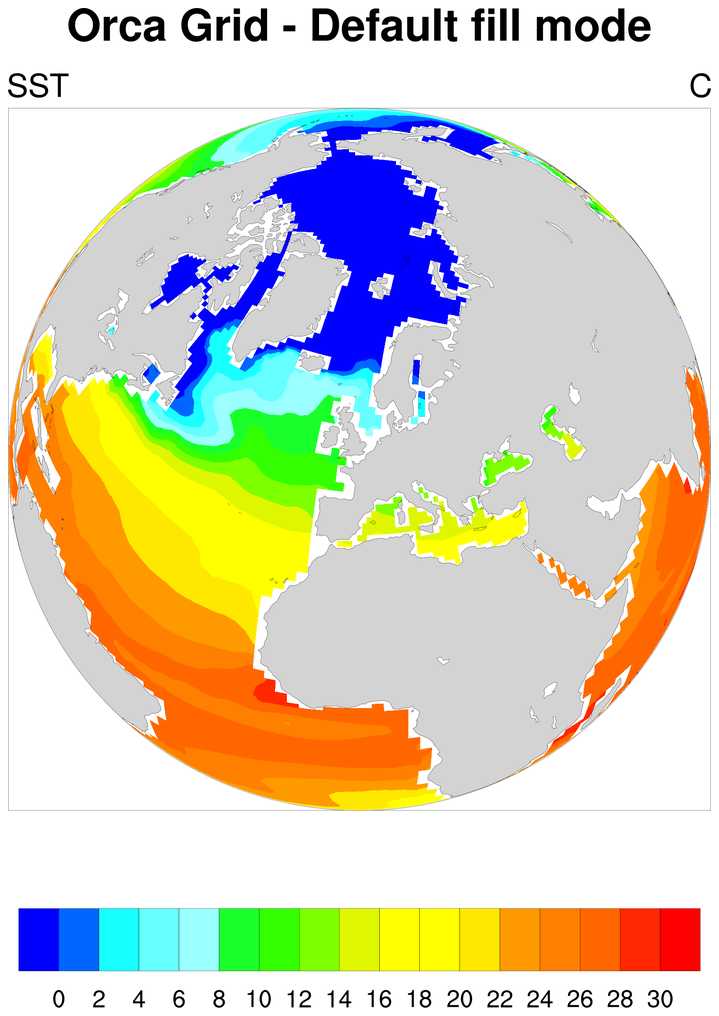
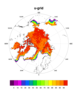
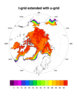
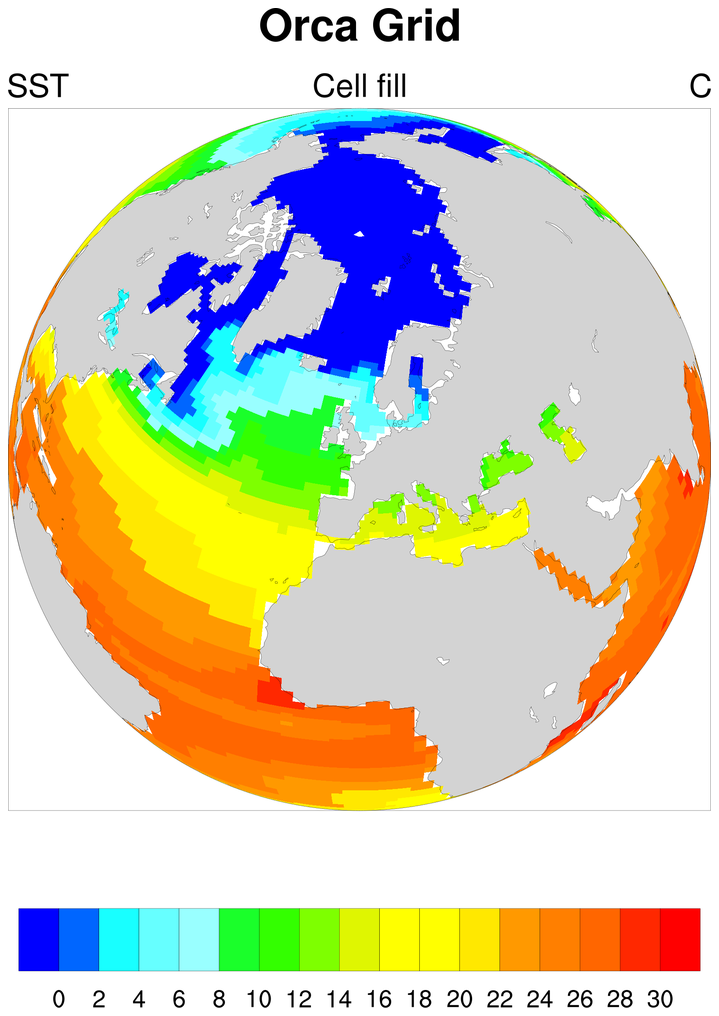
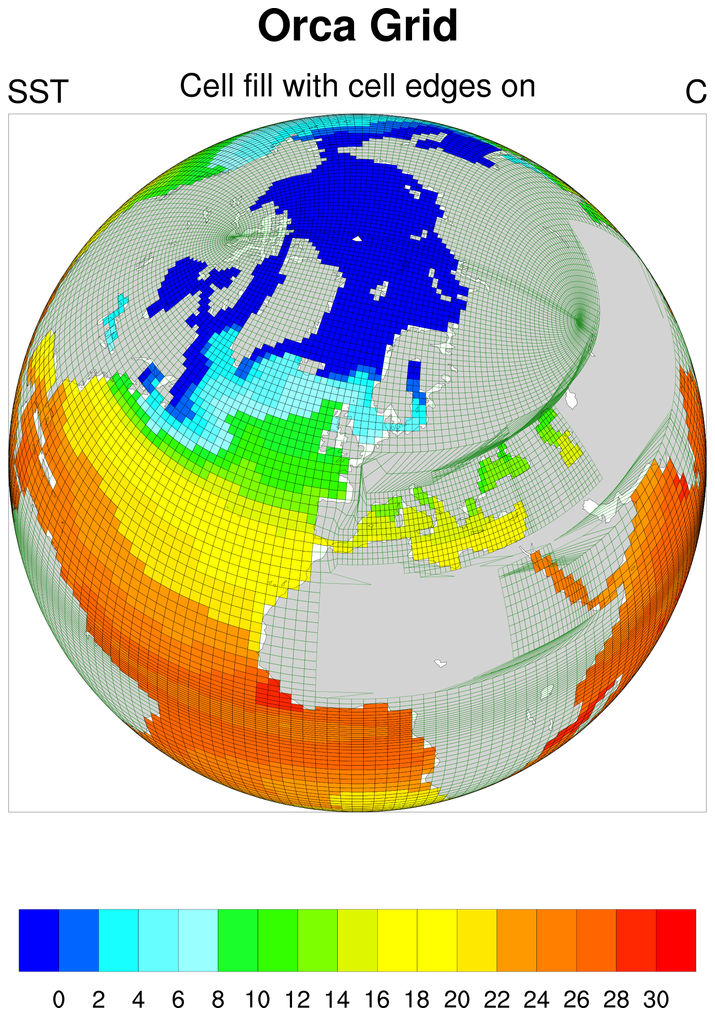
ORCA Grid
 orca_1.ncl
:
Note that the
trGridType
resource is set to "TriangularMesh" in this example, so that
it will use a triangulation algorithm to contour the mesh.
The lat/lon information must be provided by setting the resources
sfXArray and sfYArray.
This example compares the results between the default
cnFillMode value of "AreaFill"
and "RasterFill".
CICE Tripole Grid
 ice_4.ncl
: This 3 frame plot
demonstrates a solution to the gap that appears along a line
between the two northern poles for data represented on the CICE
T-fold Tripole grid. Thanks to Petteri Uotila of CSIRO Marine &
Atmospheric Research in Aspendale, Victoria, Australia for
providing this solution. The first frame demonstrates the problem
when the data is plotted normally using the T-fold grid
coordinates. The second frame draws the same data but switches to
the U-fold grid coordinates that are also present in the
file. This rendering eliminates the gap but slightly misplaces the
data in the coordinate space. The third frame shows the solution
obtained by adding the top row of the U-fold grid to the T-fold
grid and simply repeating the top row data in a row added to the
data array.


