NCL Graphics: Plotting POP Grid
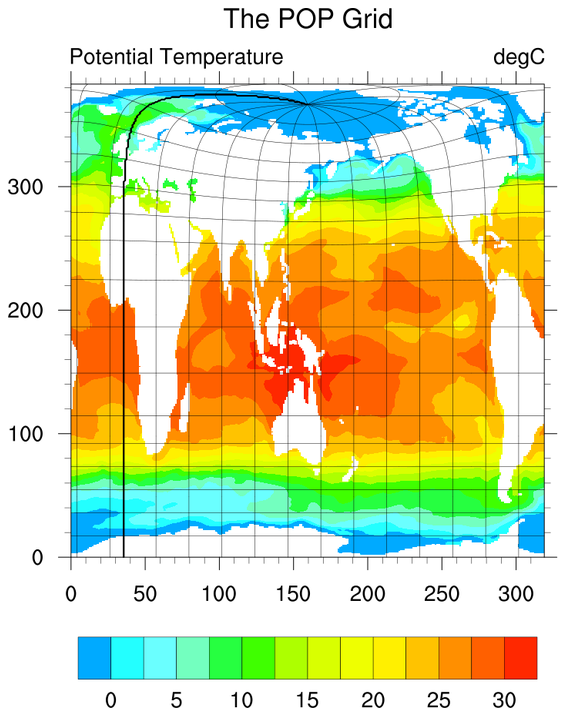
This page demonstrates what a POP Ocean Model grid looks like.
popgrid_1.ncl:
This plot uses overlay to put contours of both latitude and longitude on the plot. This technique will only work with grids that have 2D lat/lon coordinates.