       t@lon2d   = f->TLAT
       t@lat2d   = f->TLONG
NCL Home>
Application examples>
Models ||
Data files for some examples
 popmask_2.ncl:
Use the REGION_MASK basin index value of 6 to plot only the Atlantic basin. Zoom in on that area.
popmask_2.ncl:
Use the REGION_MASK basin index value of 6 to plot only the Atlantic basin. Zoom in on that area.
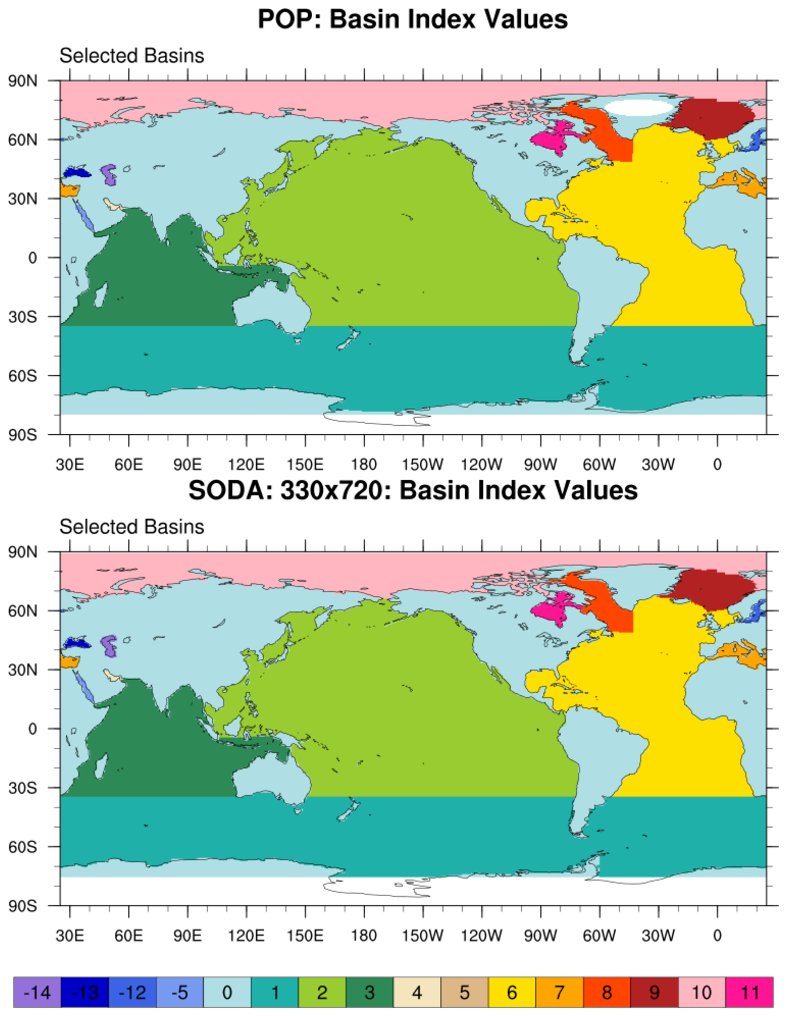
 popmask_3.ncl:
Derive a mask for the SODA
dataset using the POP REGION_MASK variable. The REGION_MASK variable
is categorical so a nearest neighbor approach is used.
Several NCL functions are used to reduce the
computational load. Only a subset of distance calculations
are performed. A netCDF file is created and a plot illustrating
the original and derived region mask is generated. This took about
300 seconds on a Mac.
popmask_3.ncl:
Derive a mask for the SODA
dataset using the POP REGION_MASK variable. The REGION_MASK variable
is categorical so a nearest neighbor approach is used.
Several NCL functions are used to reduce the
computational load. Only a subset of distance calculations
are performed. A netCDF file is created and a plot illustrating
the original and derived region mask is generated. This took about
300 seconds on a Mac.
Example pages containing:
tips |
resources |
functions/procedures
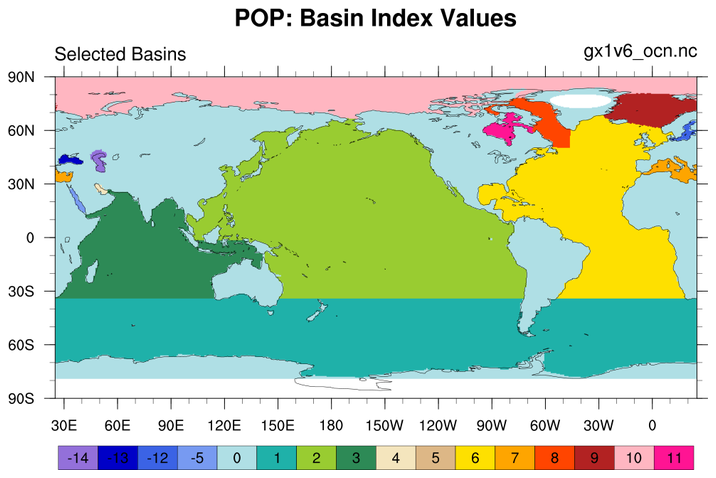
NCL Graphics: POP Basins and Masking
POP data that have 2D lat/lon coordinates can be plotted directly
in physical space. To do this, simply read in the two dimensional
arrays containing the grid point coordinates and assign the arrays
to the variable to be plotted as attributes with the specific
names lon2d and lat2d:
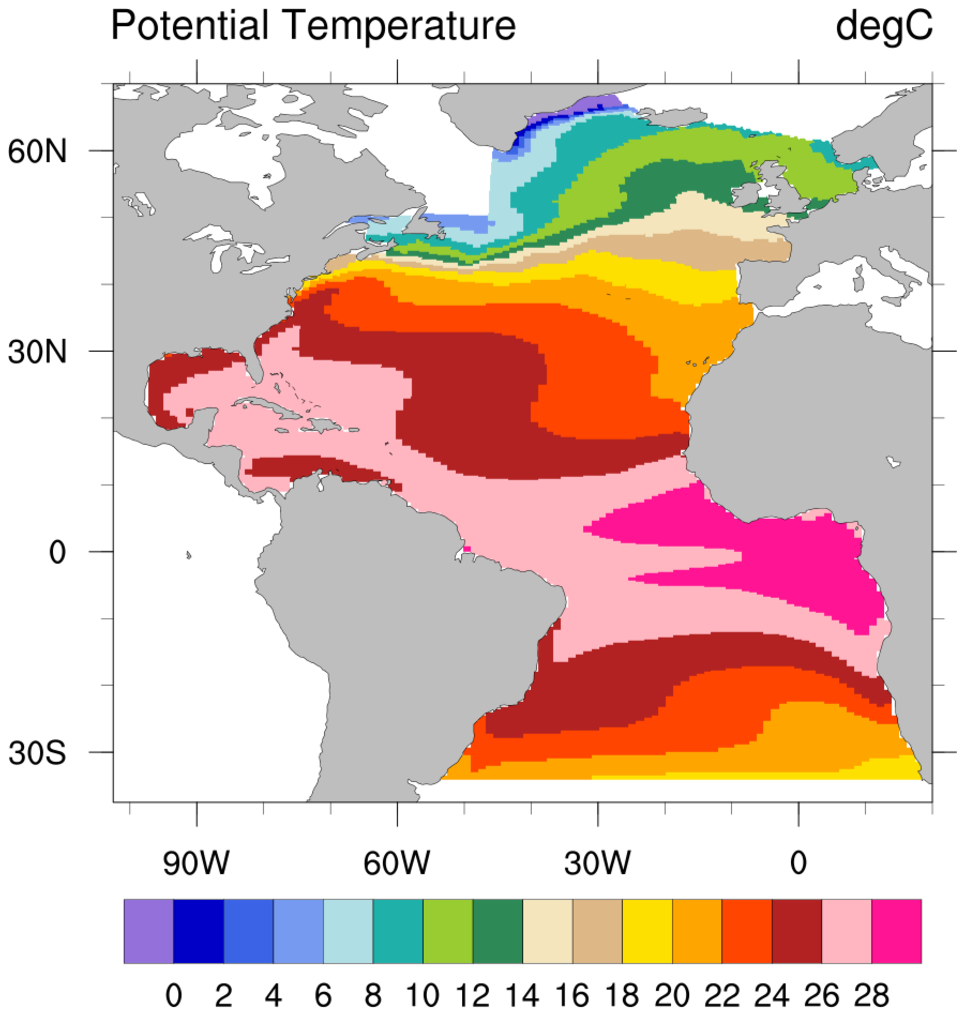 popmask_2.ncl:
Use the REGION_MASK basin index value of 6 to plot only the Atlantic basin. Zoom in on that area.
popmask_2.ncl:
Use the REGION_MASK basin index value of 6 to plot only the Atlantic basin. Zoom in on that area.
 popmask_3.ncl:
Derive a mask for the SODA
dataset using the POP REGION_MASK variable. The REGION_MASK variable
is categorical so a nearest neighbor approach is used.
Several NCL functions are used to reduce the
computational load. Only a subset of distance calculations
are performed. A netCDF file is created and a plot illustrating
the original and derived region mask is generated. This took about
300 seconds on a Mac.
popmask_3.ncl:
Derive a mask for the SODA
dataset using the POP REGION_MASK variable. The REGION_MASK variable
is categorical so a nearest neighbor approach is used.
Several NCL functions are used to reduce the
computational load. Only a subset of distance calculations
are performed. A netCDF file is created and a plot illustrating
the original and derived region mask is generated. This took about
300 seconds on a Mac.
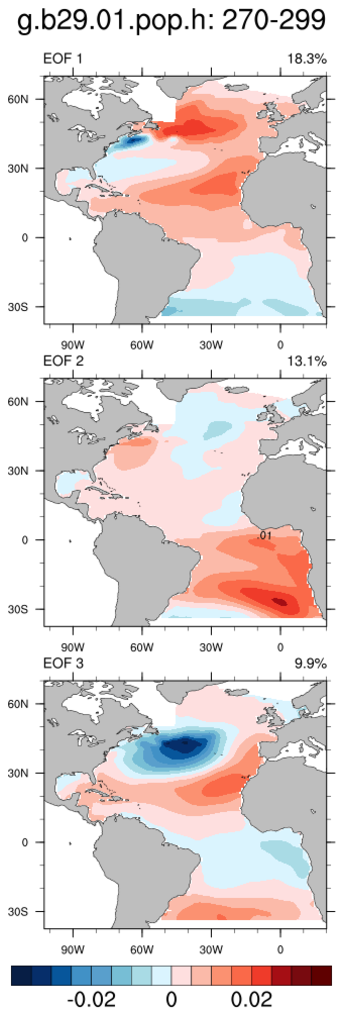
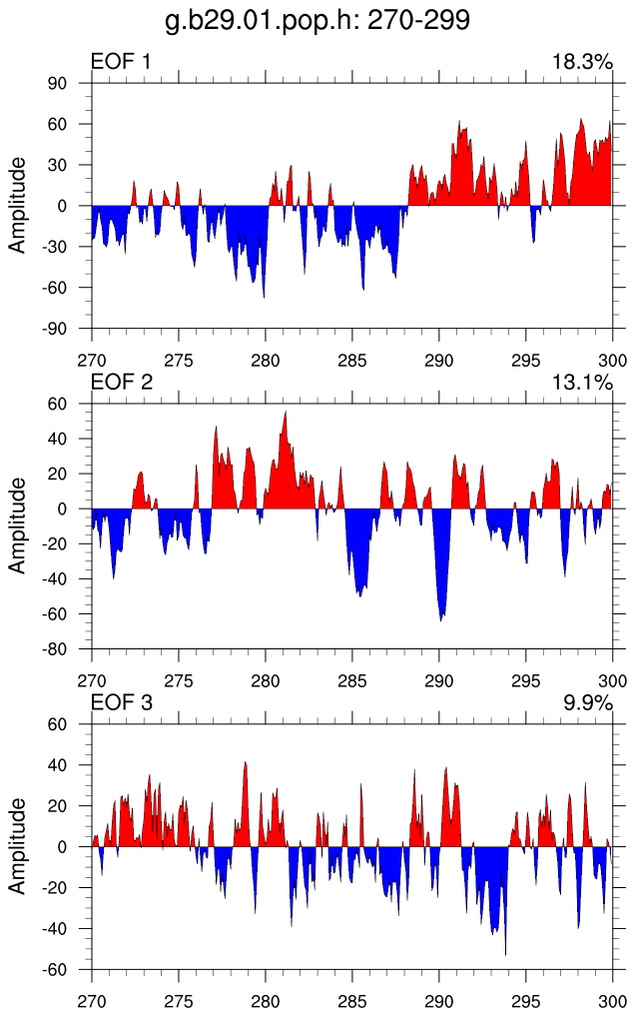
eof_3.ncl: From a directory with many POP files, (1) read 30 years spanning years 270-279, (2) compute climatology, (3) compute anomalies, (4) mask out all regions but the Atlantic basin, (5) weight grid by area, (6) compute EOFs, and (7) plot.