NCL Home>
Application examples>
Models ||
Data files for some examples
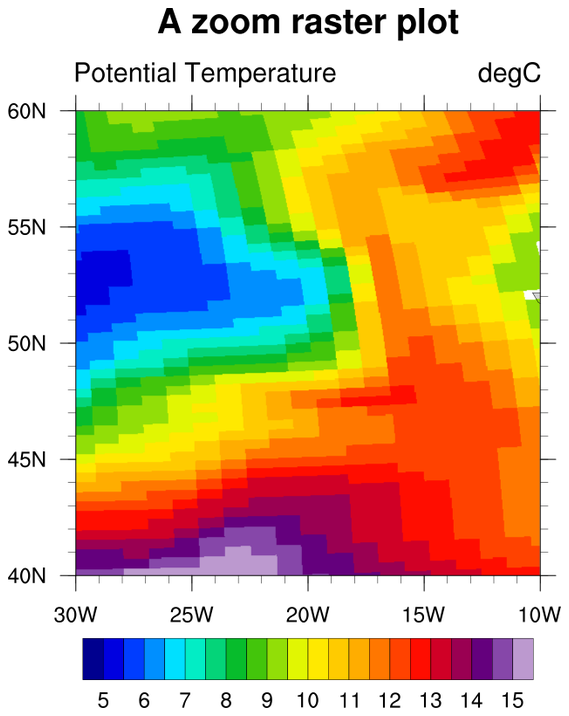
 poprast_1.ncl: The trick to
tell NCL to create raster plots based on cell boundaries, is to have
one more element in the coordinate arrays than the corresponding
dimension in the data array.
poprast_1.ncl: The trick to
tell NCL to create raster plots based on cell boundaries, is to have
one more element in the coordinate arrays than the corresponding
dimension in the data array.
Note that for the pop grid, ULONG and ULAT represent the cell boundaries. These are the arrays that need to be used.
Example pages containing:
tips |
resources |
functions/procedures
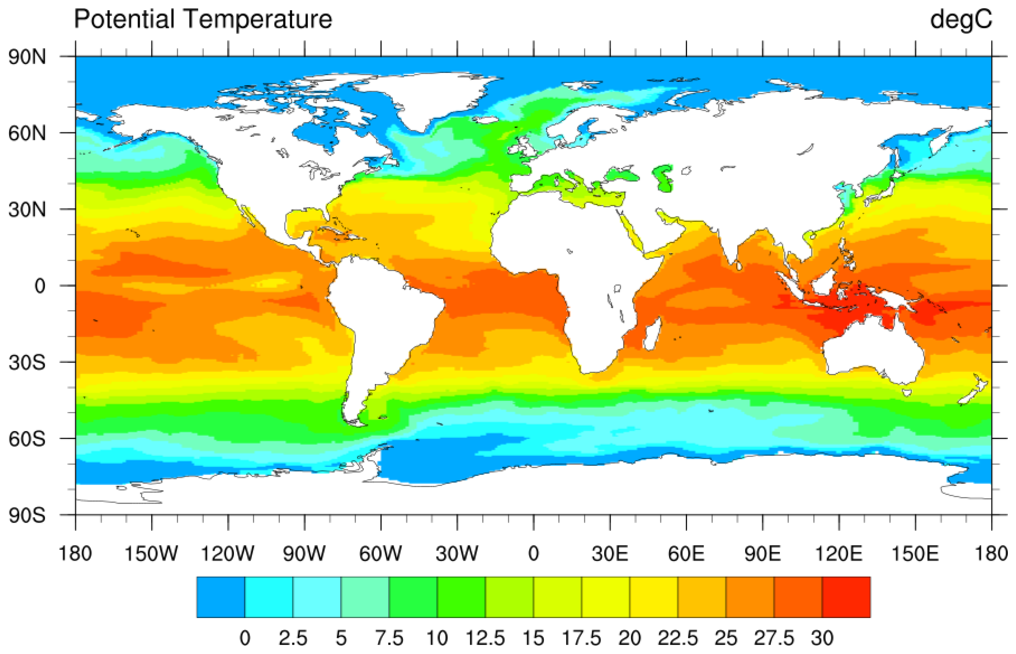
NCL Graphics: POP Data in Raster Mode
POP data that have 2D lat/lon coordinates
can be plotted directly in physical space. Raster images of grids of
this type are different from other raster grids in that we want the
raster cell to be defined by its boundaries since there may be cells
that are not perfect squares. The default raster behavior is to place
the value in the center of a square.
 poprast_1.ncl: The trick to
tell NCL to create raster plots based on cell boundaries, is to have
one more element in the coordinate arrays than the corresponding
dimension in the data array.
poprast_1.ncl: The trick to
tell NCL to create raster plots based on cell boundaries, is to have
one more element in the coordinate arrays than the corresponding
dimension in the data array.
Note that for the pop grid, ULONG and ULAT represent the cell boundaries. These are the arrays that need to be used.