NCL Home>
Application examples>
Data Analysis ||
Data files for some examples
vinth2p: Converts data from hybrid coordinates to pressure levels. This function requires that P0 be in mb. Note: This NCL function was copied from the old CSM Processor, and therefore works only with CSM data. If non-model data is used, then the hybrid a coefficients should be normalized by 1 Pa.
vinth2p: was written to converts CESM data from hybrid coordinates to pressure levels. Hybrid coordinates are a mix of sigma and pressure coordinates. Because of this, vinth2p can be tricked into converting straight sigma coordinates.
On a CESM model file there are two arrays, hybi (which represents the sigma coefficients), and hyai (which represents which levels are hybrid in nature). To use vinth2p for sigma coordinates, simply create a fake hyba array (e.g. all zeros), and set P0 to be 1000.
int2p is the NCL built-in function that interpolates from one pressure grid to another.
Setting tmYRMode to "Automatic" will remove the height labels from the right side of the plot template.
sigma2hybrid interpolates from sigma to hybrid coordinates.
Example pages containing: tips | resources | functions/procedures
NCL: Vertical Interpolation
HYBRID to PRESSURE
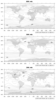
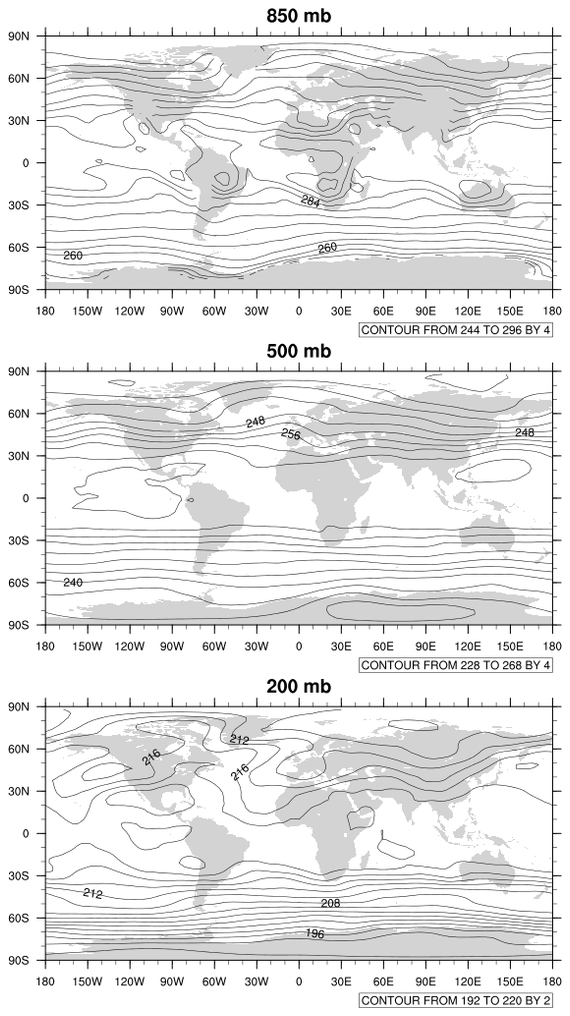
vert_1.ncl: Reads in data from a netCDF file converts from hybrid coordinates to pressure levels, and creates a three panel plot.vinth2p: Converts data from hybrid coordinates to pressure levels. This function requires that P0 be in mb. Note: This NCL function was copied from the old CSM Processor, and therefore works only with CSM data. If non-model data is used, then the hybrid a coefficients should be normalized by 1 Pa.

SIGMA to PRESSURE
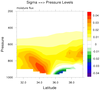
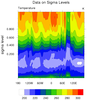
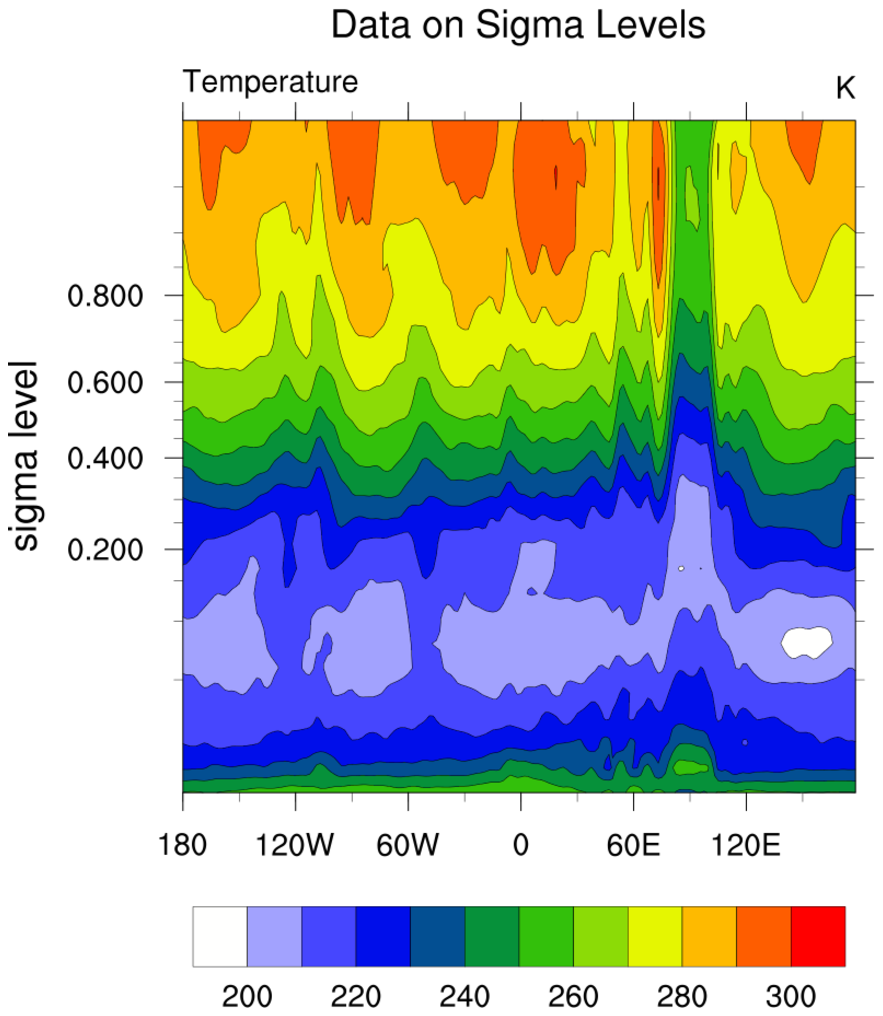
vert_2.ncl: Reads in data from a netCDF file converts from sigma coordinates to pressure levels, calculates a flux and finally creates slice plot.vinth2p: was written to converts CESM data from hybrid coordinates to pressure levels. Hybrid coordinates are a mix of sigma and pressure coordinates. Because of this, vinth2p can be tricked into converting straight sigma coordinates.
On a CESM model file there are two arrays, hybi (which represents the sigma coefficients), and hyai (which represents which levels are hybrid in nature). To use vinth2p for sigma coordinates, simply create a fake hyba array (e.g. all zeros), and set P0 to be 1000.
PRESSURE to PRESSURE
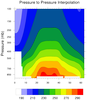
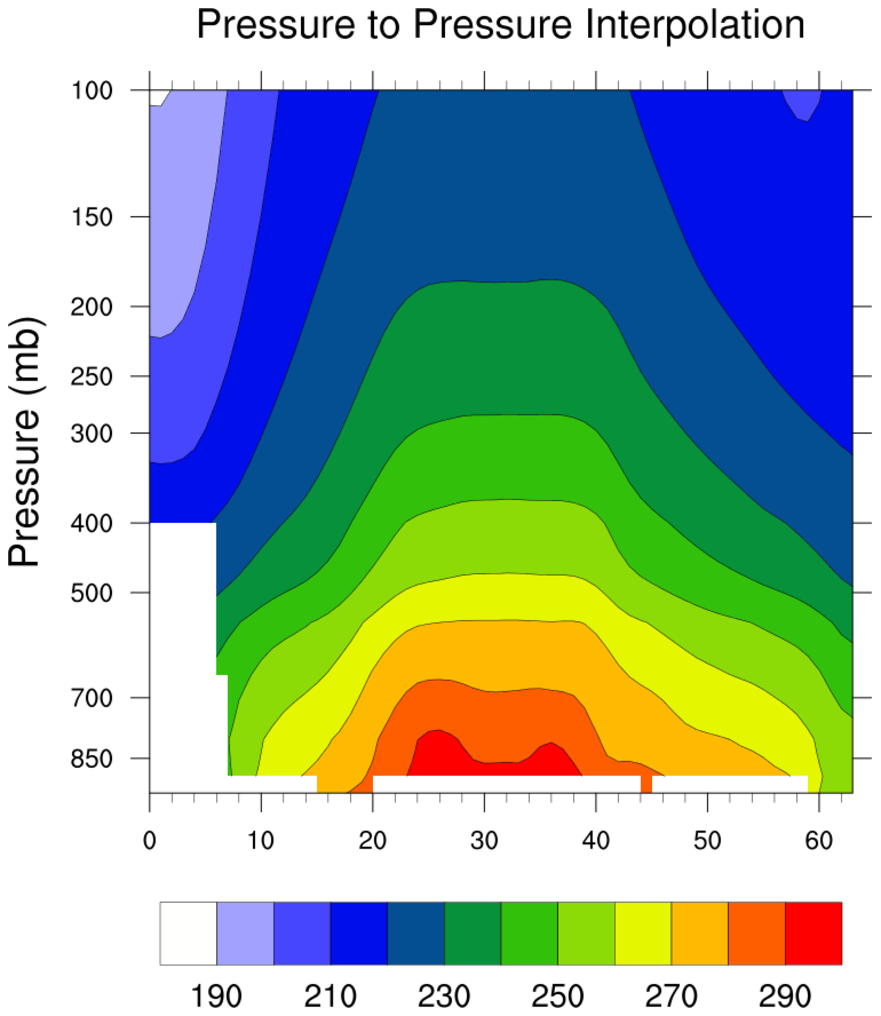
vert_3.ncl: Interpolation of one set of pressure levels to another.int2p is the NCL built-in function that interpolates from one pressure grid to another.
Setting tmYRMode to "Automatic" will remove the height labels from the right side of the plot template.

SIGMA to HYBRID
vert_4.ncl: Interpolation from sigma coordinates to hybrid coordinates.sigma2hybrid interpolates from sigma to hybrid coordinates.
SIGMA to REGULAR Ocean model example.