This page is rather out-of-date. We recommend that you visit the
more up-to-date
WRF-ARW
Online Tutorial for examples of using NCL to plot WRF-ARW
data.
The WRF "3D" model output uses cartesian coordinates (MAP_PROJ=0).
Geographic related variables and information (eg, XLAT, XLONG,
CEN_LAT, etc) are zero-filled and can be ignored. The distance
between grid points and the time-step are available from the
global attributes DX, DY and DT, respectively.
All subscript references in the global attributes refer to
Fortran ordering. They start at one (1): eg:
WEST-EAST_PATCH_START_UNSTAG=1. Remember that NCL is written in C. A
Fortran subscript of 1 corresponds to an NCL subscript of 0.
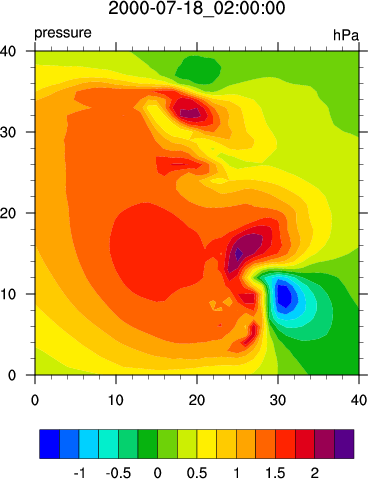
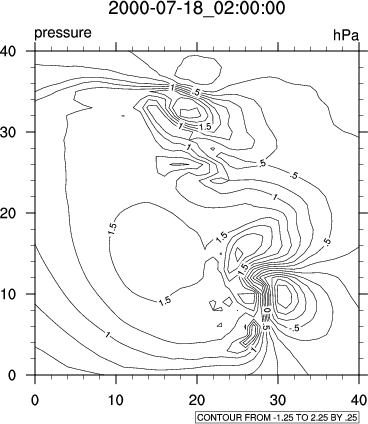
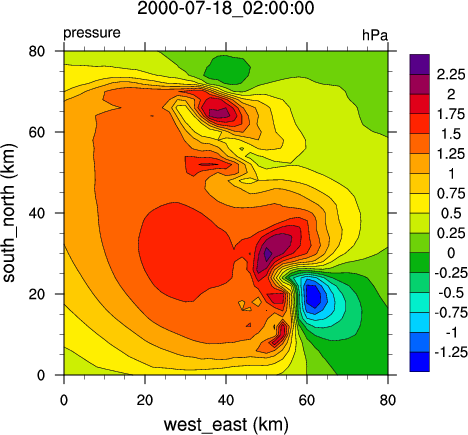
 WRF_3d_1.ncl
: A simple plane view of
the pressure field at a specific time and level is presented.
chartostring, is used to convert the times variable
(which is of type character) to type string for plotting purposes.
The default contour mode is black and white. Setting the
cnFillOn turns
on color. NCL's default color map contains very distinct colors. It is generally
not used for contour plots. Learn more about
color techniques.
For illustration, the x and y coordinates are calculated and plotted.