Many additional xy plot examples are available.
NCL Home>
Application examples>
Models ||
Data files for some examples
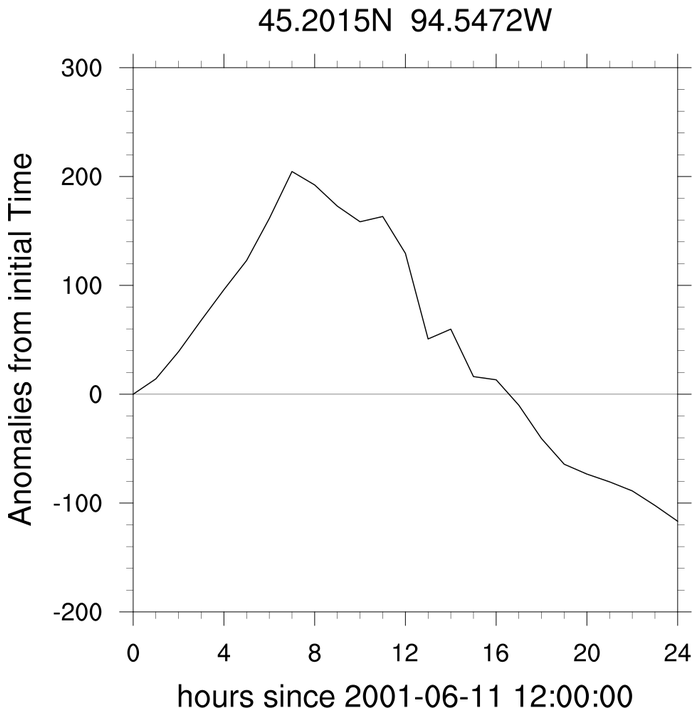
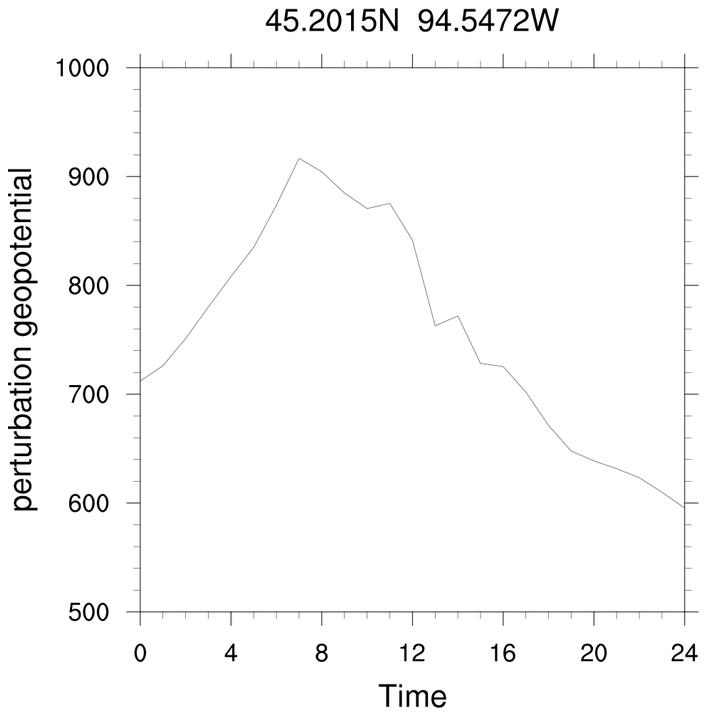
 WRF_xy_1.ncl: Plot a time
series from a variable at a user specified grid location. Use the
wrf_times_c function
to convert the auxiliary variable "Times" to
units of hours since the initial time. Three simple variations are
illustrated.
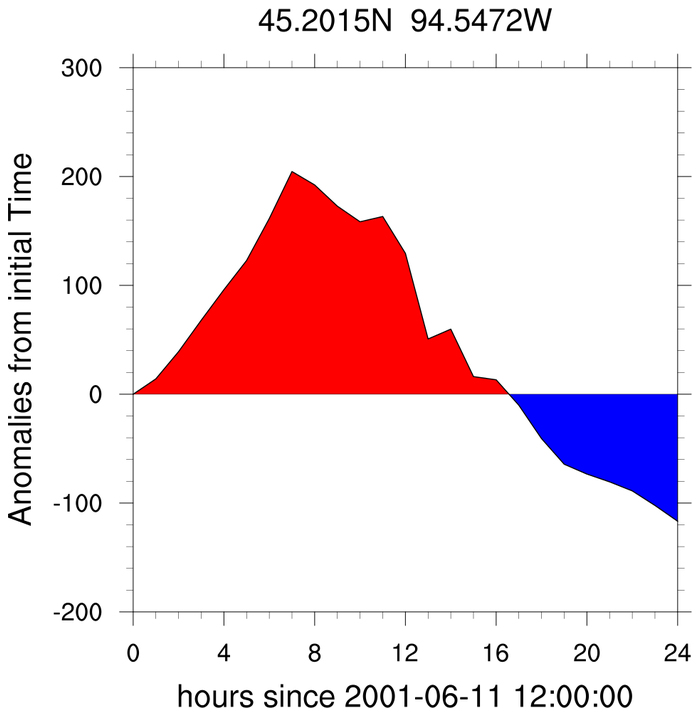
WRF_xy_1.ncl: Plot a time
series from a variable at a user specified grid location. Use the
wrf_times_c function
to convert the auxiliary variable "Times" to
units of hours since the initial time. Three simple variations are
illustrated.

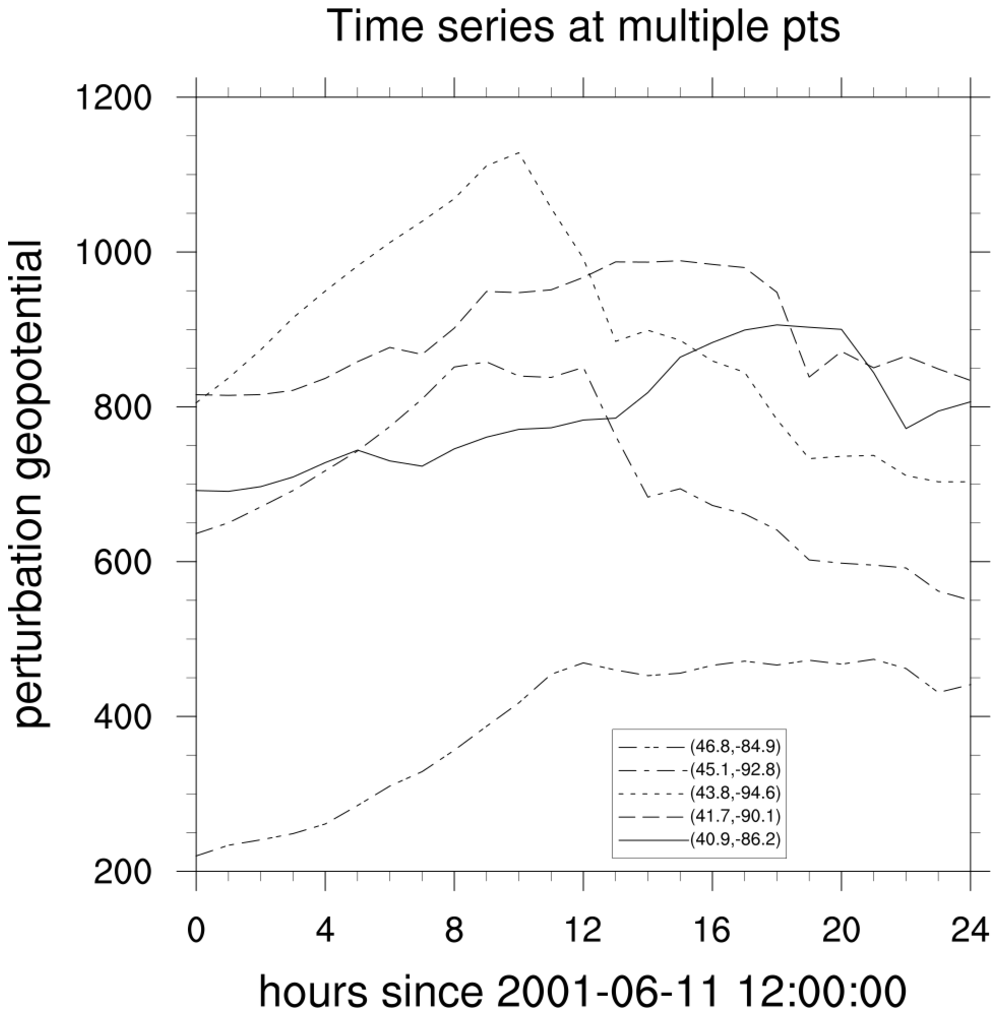
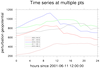 WRF_xy_2.ncl:Read time series from
multiple grid points and plot. Create a graphic
legend that identifies the points used.
Illustrate color and reshaping of figure.
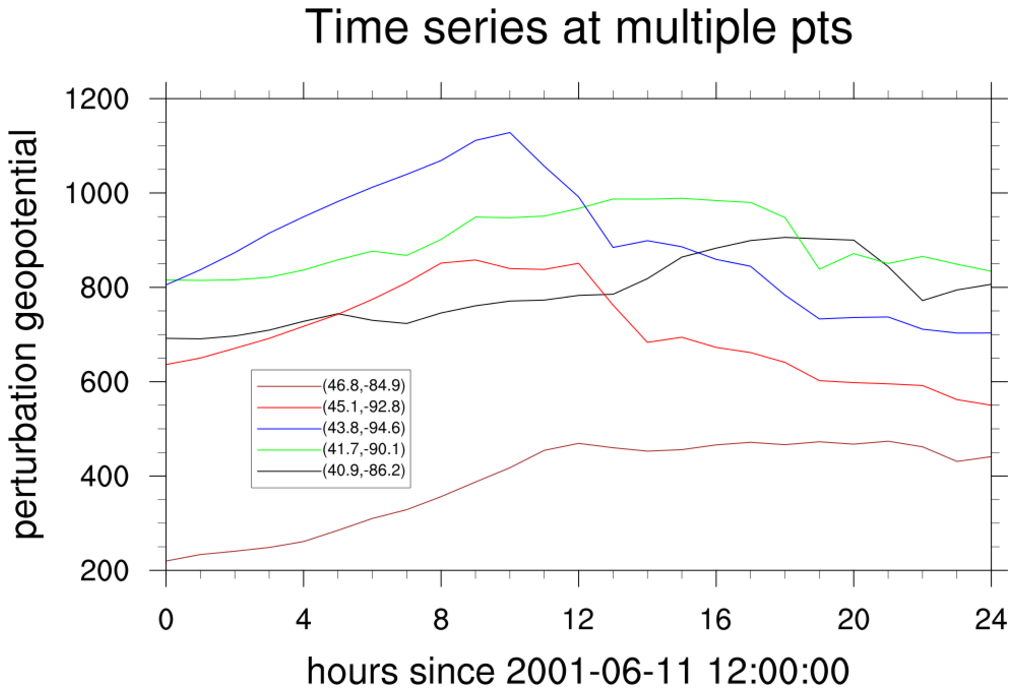
WRF_xy_2.ncl:Read time series from
multiple grid points and plot. Create a graphic
legend that identifies the points used.
Illustrate color and reshaping of figure.
Example pages containing:
tips |
resources |
functions/procedures
NCL Graphics: WRF XY plots
The purpose of this page is to show some very basic scripts for
creating XY plots of WRF variables using
gsn_csm_xy.
For more meaningful plots of WRF data, see the WRF-ARW
Online Tutorial.
 WRF_xy_1.ncl: Plot a time
series from a variable at a user specified grid location. Use the
wrf_times_c function
to convert the auxiliary variable "Times" to
units of hours since the initial time. Three simple variations are
illustrated.
WRF_xy_1.ncl: Plot a time
series from a variable at a user specified grid location. Use the
wrf_times_c function
to convert the auxiliary variable "Times" to
units of hours since the initial time. Three simple variations are
illustrated.
 WRF_xy_2.ncl:Read time series from
multiple grid points and plot. Create a graphic
legend that identifies the points used.
Illustrate color and reshaping of figure.
WRF_xy_2.ncl:Read time series from
multiple grid points and plot. Create a graphic
legend that identifies the points used.
Illustrate color and reshaping of figure.