kde_n_test
Uses gaussian kernel density estimation (KDE) to estimate the probability density function of a random variable. This function is under construction and is available for testing only. It may not be released with NCL V6.5.0.
 Available in version 6.5.0 and later.
Prototype
	function kde_n_test (
		x        : numeric,
		bin  [*] : numeric,
		dims [*] : integer
	)

	return_val  :  float or double
Arguments
xA variable of any numeric type and any dimensionality. Missing values (i.e. _FillValue) are allowed but are ignored. The data are sorted internally.
binUser supplied, evenly-spaced band boundaries. One approach:
bin = fspan(min(x), max(x), m) ... m user specified
dims
The dimension(s) of x on which to calculate the KDE. Must be consecutive and monotonically increasing.
Return value
Returns a variable of type float or double with dimensions N x nbin, where N represents all but the dims dimensions of x, and nbin is the length of bin. The returned variable will have an attribute band_width.
Description
This function is under construction and is available for testing only. It may not be released with NCL V6.5.0.
Kernel Density Estimators (KDEs) are a generalization and improvement over histograms. A KDE is a non-parametric way to estimate the probability density function of a random variable. Internally, a specified density function (the kernel) is averaged across the observed data points to create a smooth approximation. This function uses a Gaussian kernel.
Technically, each dims dimension of x is an independent and identically distributed sample drawn from some distribution with an unknown probability distribution.
The returned bandwidth attribute represents the "plug-in" derived bandwidth used to estimate the kernel density. It is derived assuming the underlying density being estimated is Gaussian. Hence, this approximation is termed the normal distribution approximation. The returned bandwith is the ideal effective width of the sliding window used to generate the density.
The code used was developed in the group of Theo Gasser by several people, mainly Walter Koehler, Alois Kneip and Eva Herrmann.
References:
   T. Duong (2001): An Introduction to Kernel Density Estimation
   J. Engel, Eva Herrmann and Theo Gasser (1994):

  An iterative bandwidth selector for kernel estimation of densities and their derivatives.
   Journal of Nonparametric Statistics 4,21-34.
   WIKIPEDIA: Kernel Density Estimation
   R: Histograms and Density Plots
See Also
Histograms, Probability Distribution Functions, Extreme Value Statistics
Examples
Example 1:
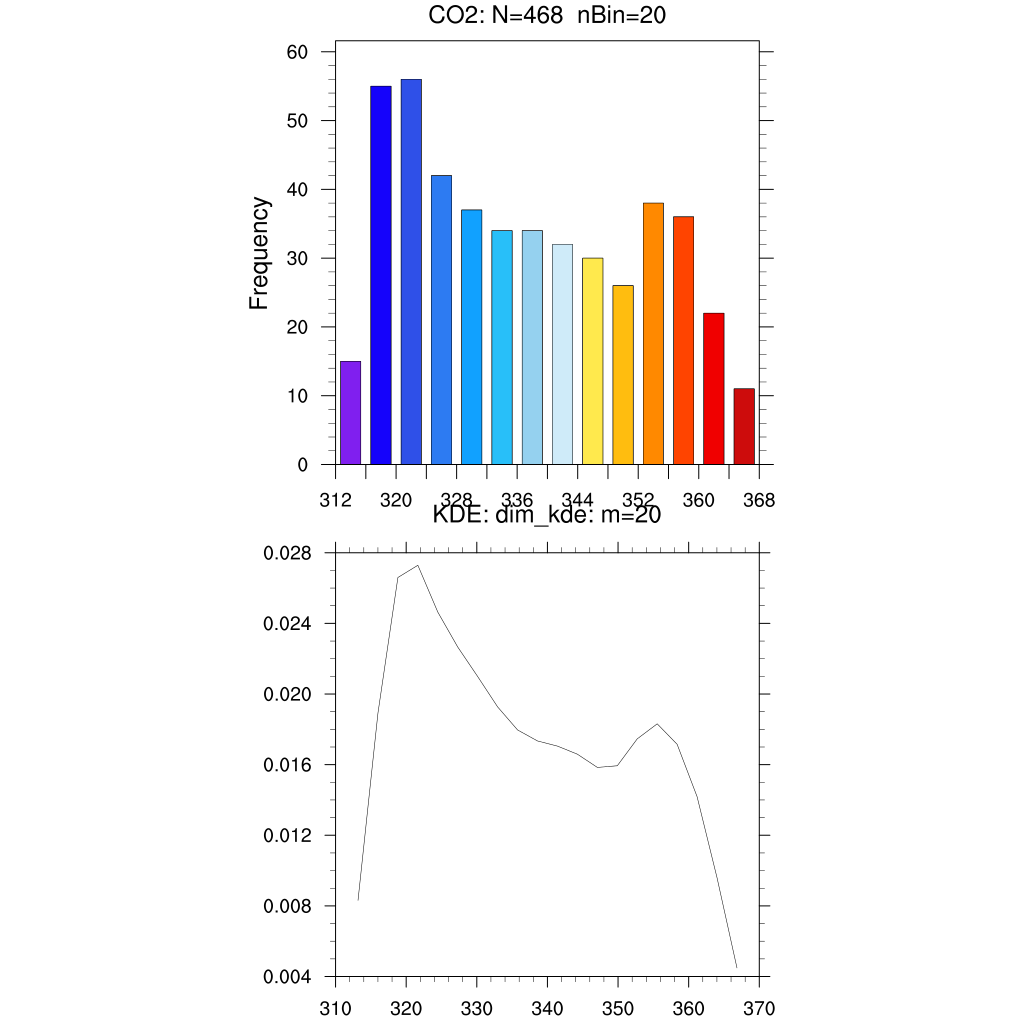
Read the CO2 data used in an R example and compute the KDE.
  diri = "./"
  fili = "co2_R.txt"                             ; year  Jan Feb ....
  pthi = diri + fili
  ncol = 13

  DATA = readAsciiTable(pthi, ncol, "float", 1)  ; 39 x 13
  data = DATA(:,1:ncol-1)                        ; 39 x 12
  year = toint(DATA(:,0))                         ; 39
  bin  = fspan(min(x), max(x), 20)  ; 20 is arbitrary

  kde  = kde_n_test(data,bin,(/0,1/))
  print(kde)

  wks  = gsn_open_wks ("png","KDE")               ; send graphics to PNG file
  plot = new(2,graphic)

; conventional histogram

  resh                         = True
  resh@gsnDraw                 = False
  resh@gsnFrame                = False
  resh@tmXBLabelStride          = 2
  resh@gsnHistogramNumberOfBins = m
  resh@tiMainString    = "CO2: N="+nx+"  nBands="+resh@gsnHistogramNumberOfBins
  plot(0) = gsn_histogram(wks,x,resh)         ; create histogram with 20 bins

; KDE

  res              = True
  res@gsnDraw      = False
  res@gsnFrame     = False
  res@tiMainString = "KDE: kde: m="+m
  plot(1) = gsn_csm_xy (wks,bin,kde,res) ; create plot

  resP = True
  resP@gsnMaximize = True
  gsn_panel(wks,plot,(/2,1/),resP)
The following is the printed output. The png which illustrate the raw histogram and the KDE is here :
     Variable: kde
     Type: float
     Total Size: 160 bytes
                  20 values
     Number of Dimensions: 1
     Dimensions and sizes:	[20]
     Coordinates:
     Number Of Attributes: 2
         band_width:  2.7646584
        _FillValue :	-999
     (0)	0.008310404637906145
     (1)	0.01892484197867318
     (2)	0.02660068622809162
     (3)	0.02729265814591201
     (4)	0.0246401406934126
     (5)	0.02266077616486179
     (6)	0.0209884990313704
     (7)	0.0192692604053928
     (8)	0.01796419445641813
     (9)	0.0173405514578292
     (10)	0.01704959661657353
     (11)	0.01659004328256386
     (12)	0.01584238726767876
     (13)	0.01593767187451854
     (14)	0.01746199347070328
     (15)	0.01831172649388734
     (16)	0.01715100099909148
     (17)	0.01418628346503685
     (18)	0.009595145734716143
     (19)	0.004485370717108967