NCL scripts for plotting ALADIN data
[Main page | Scripts | Data]Click here for some examples of regridding data from a satellite grid to an ALADIN grid.
Note: the scripts on this page were meant to be used as a set of step-by-step examples for the NCL Workshops held in Toulouse, October 2012. Some of these scripts are very basic and not appropriate for real-world use. If you want to use the scripts on this page, we recommend using the ones with the higher numbers; for example, "ALADIN_tsur_4.ncl" rather than "ALADIN_tsur_1.ncl". Please also visit the Toulouse models applications page.
[Click on any image to see a larger version.]
| NetCDF file used for these plots is
"PLPNM50-1.75.M2006.nc", provided by Pierre Nabat,
Météo-France. Pierre contributed an XY plot script that he created during the workshop. See below. | ||
ALADIN_tsur_1.ncl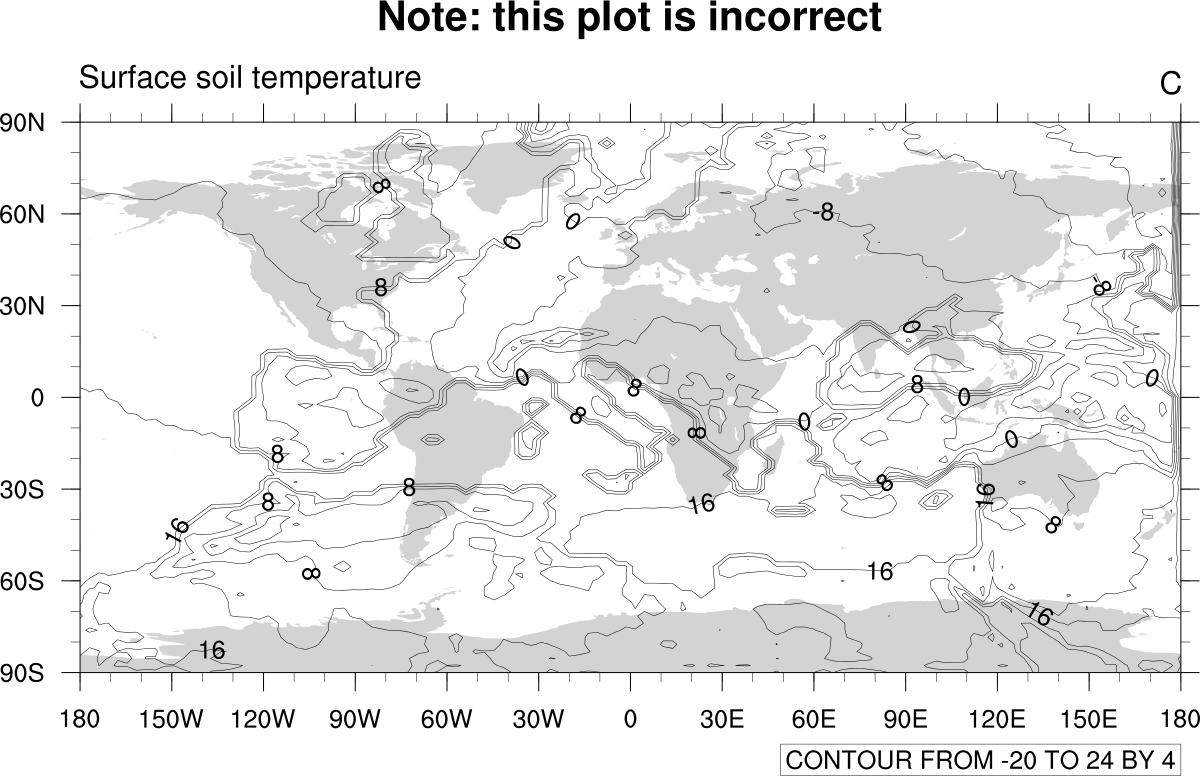
| ALADIN_tsur_2.ncl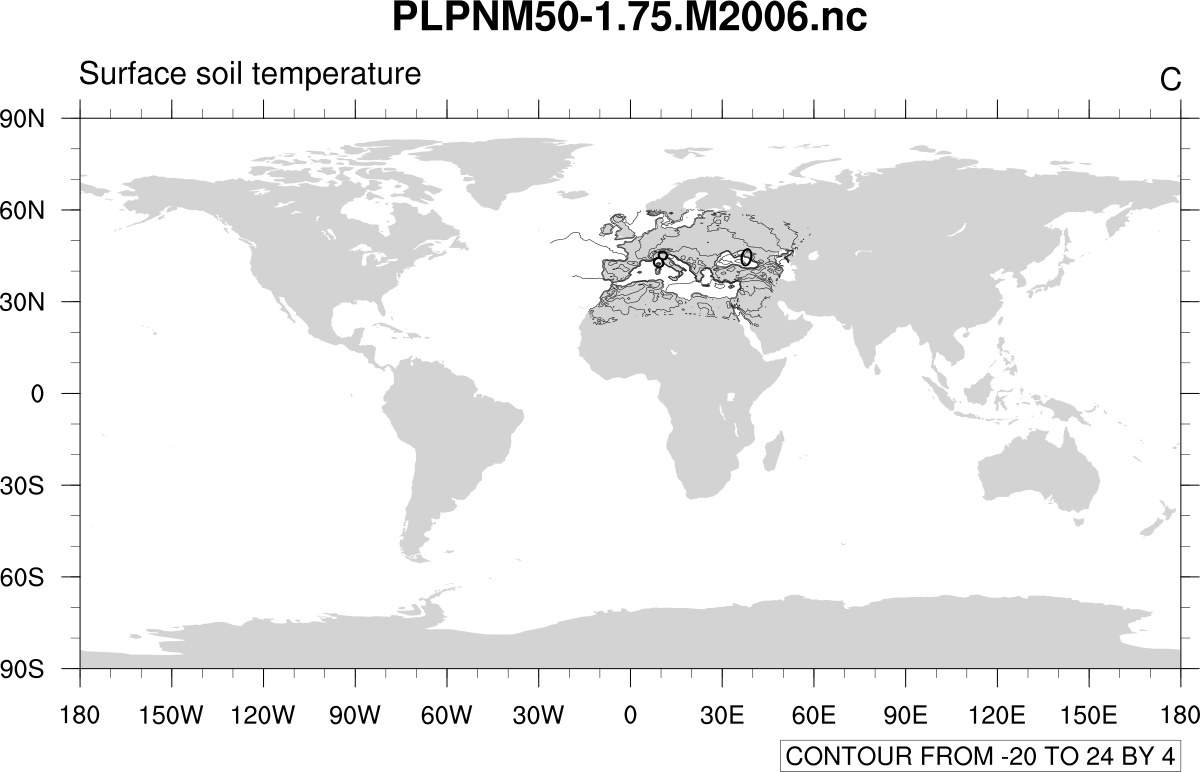
| ALADIN_tsur_3.ncl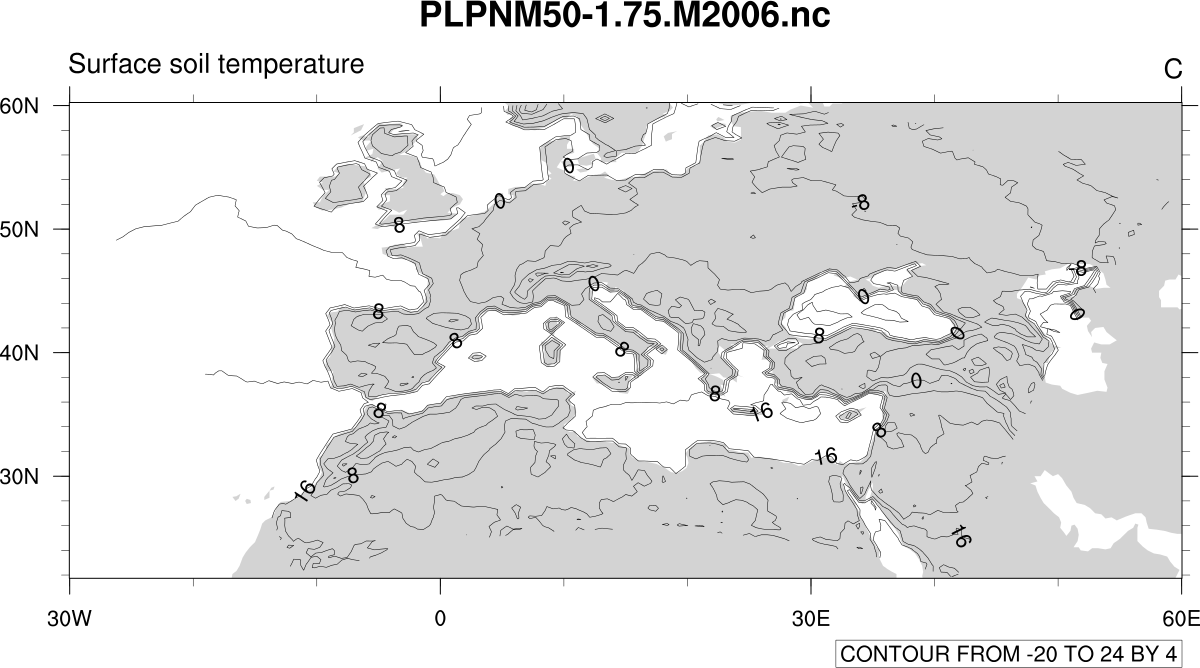
|
ALADIN_tsur_4.ncl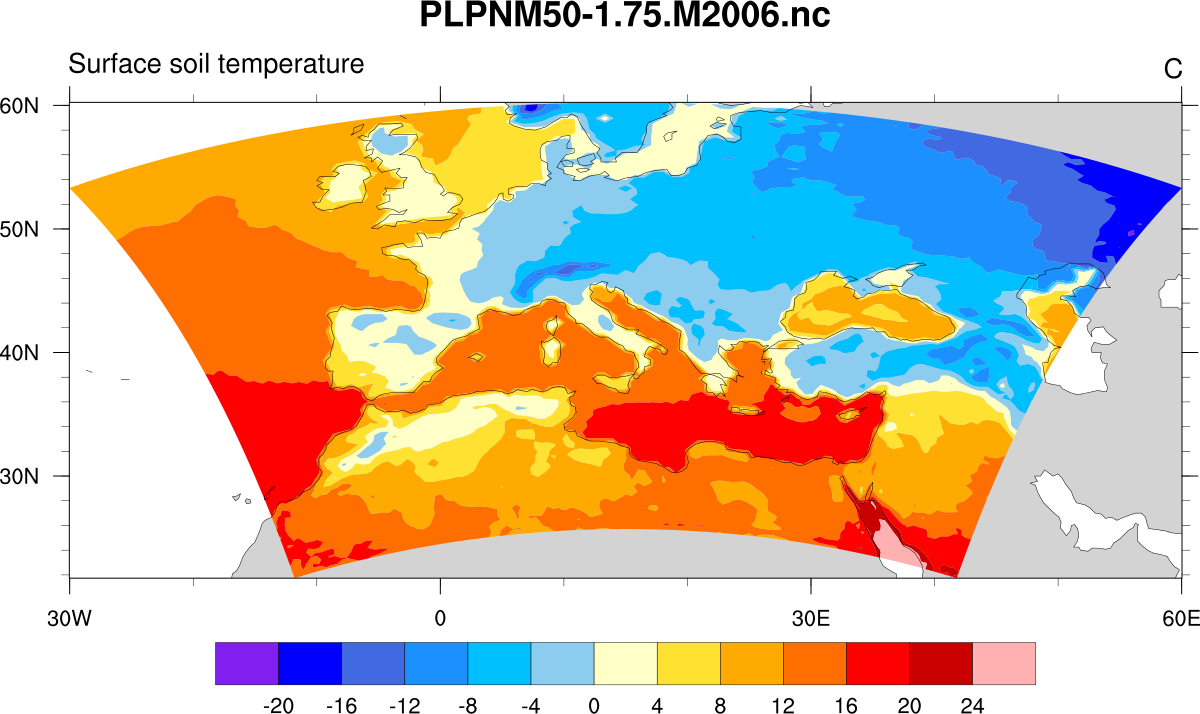
| ALADIN_tsur_5.ncl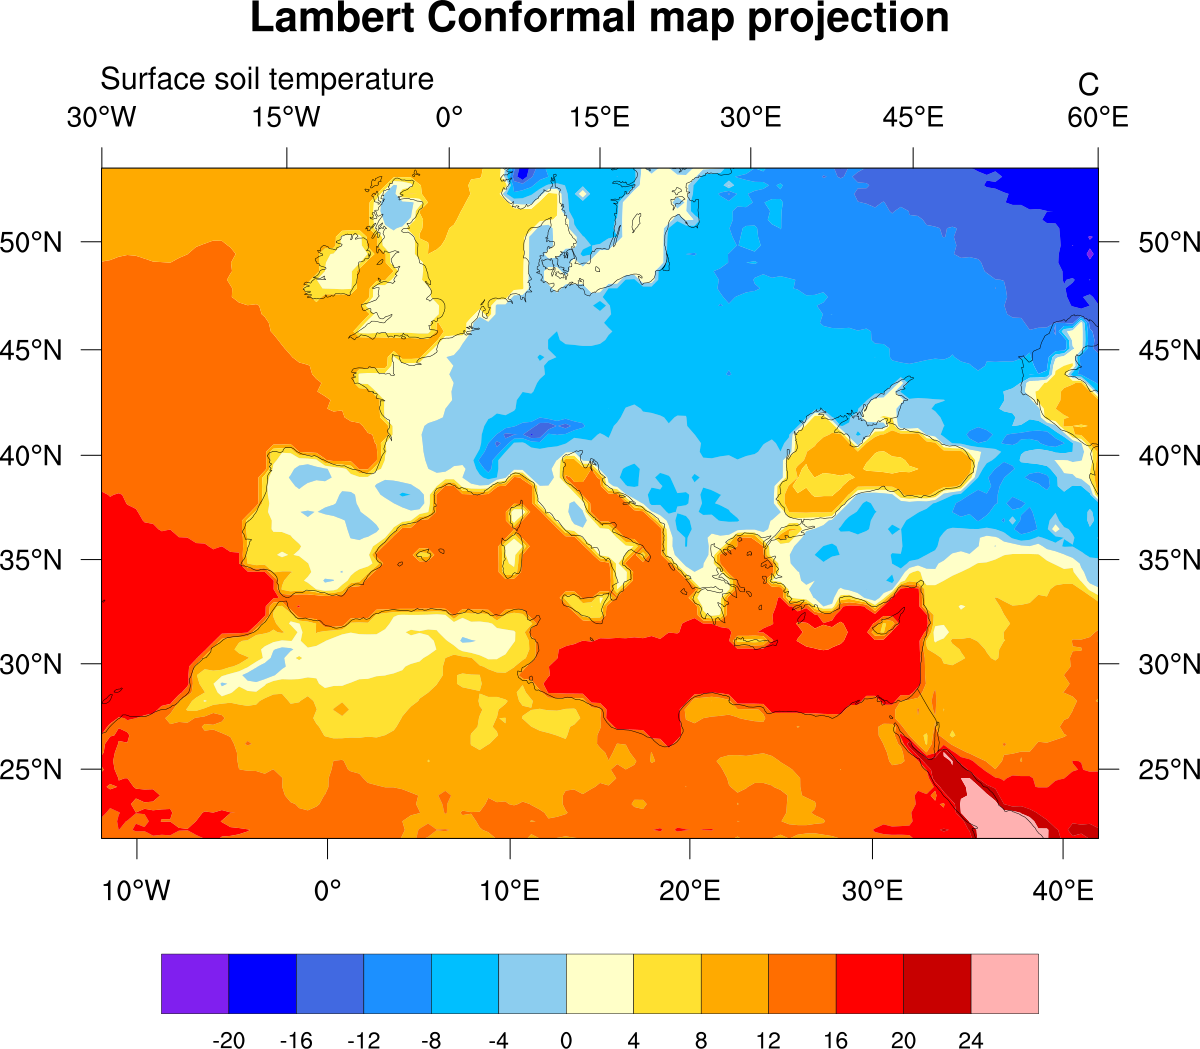
| ALADIN_tsur_6.ncl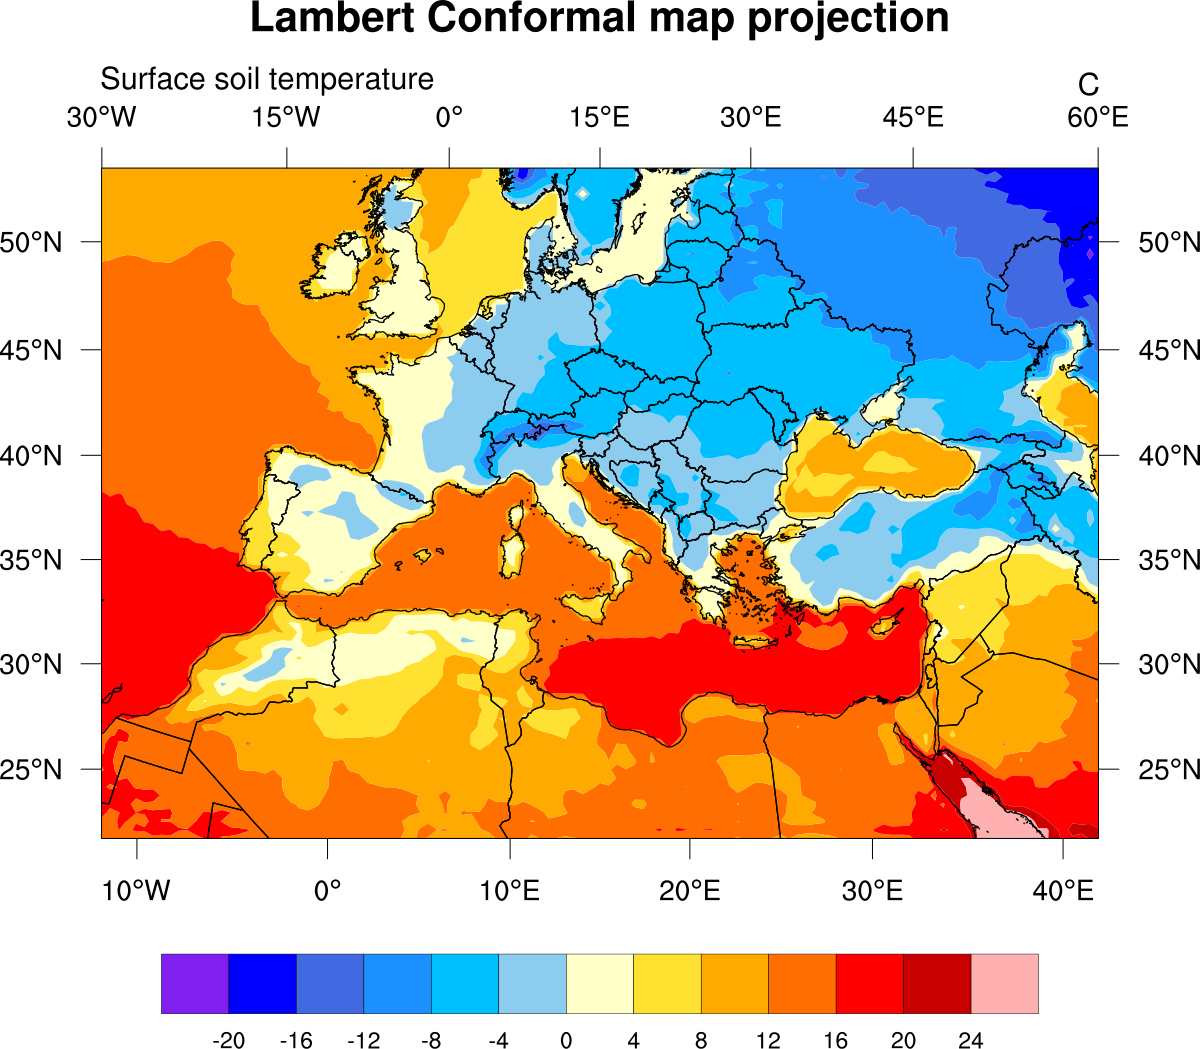
|
| NetCDF file used for these plots is "PLPNM50-1.75.M2006.nc", provided by Pierre Nabat, Météo-France. | ||
ALADIN_tsur_avg_1.ncl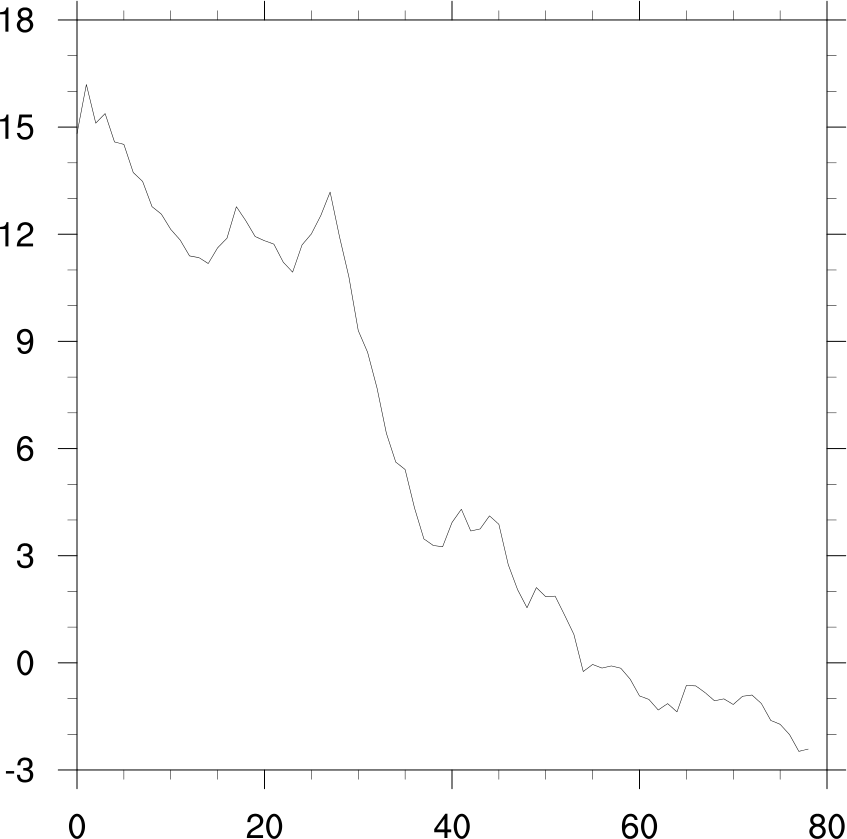
| ALADIN_tsur_avg_2.ncl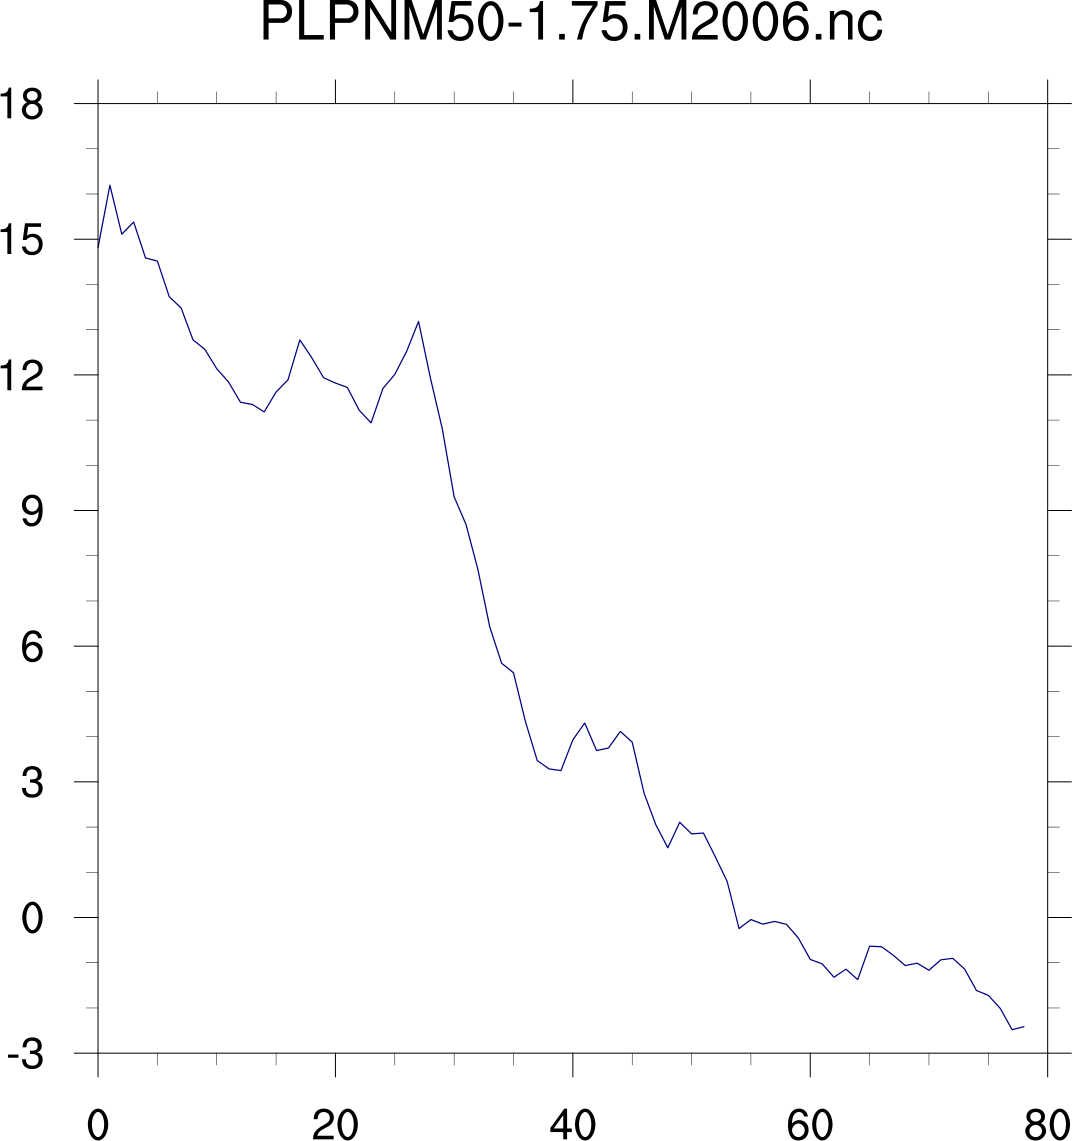
| ALADIN_tsur_avg_3.ncl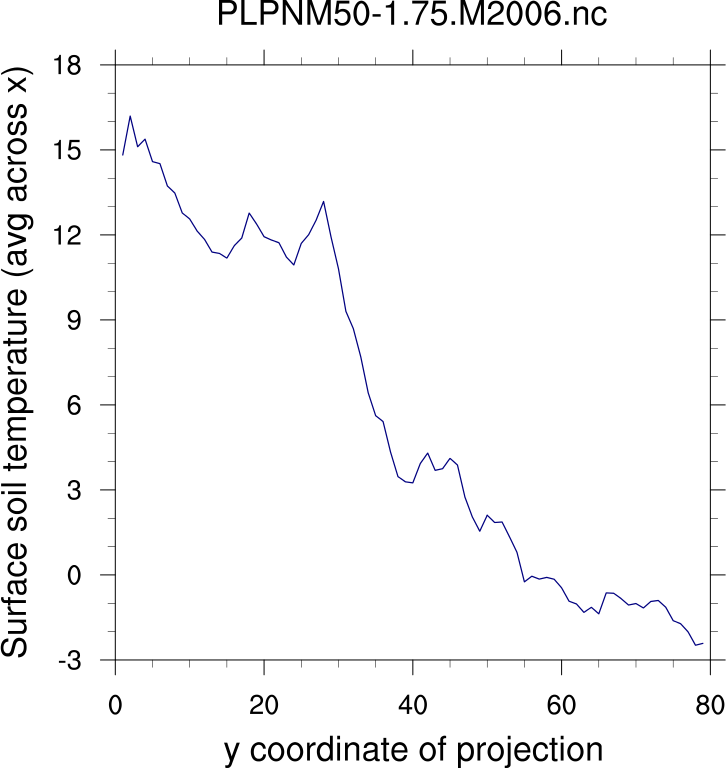
|
ALADIN_tsur_avg_4.ncl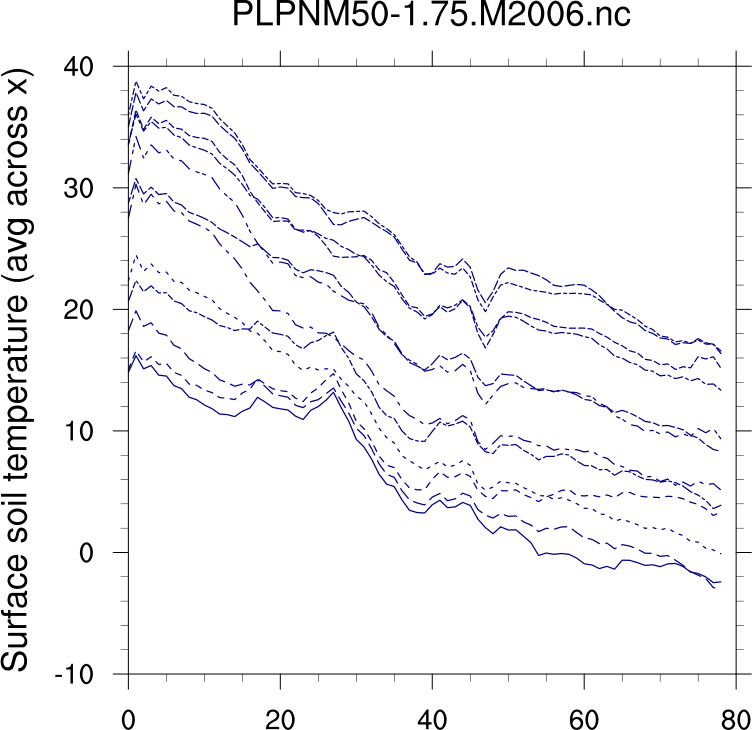
| ALADIN_tsur_avg_5.ncl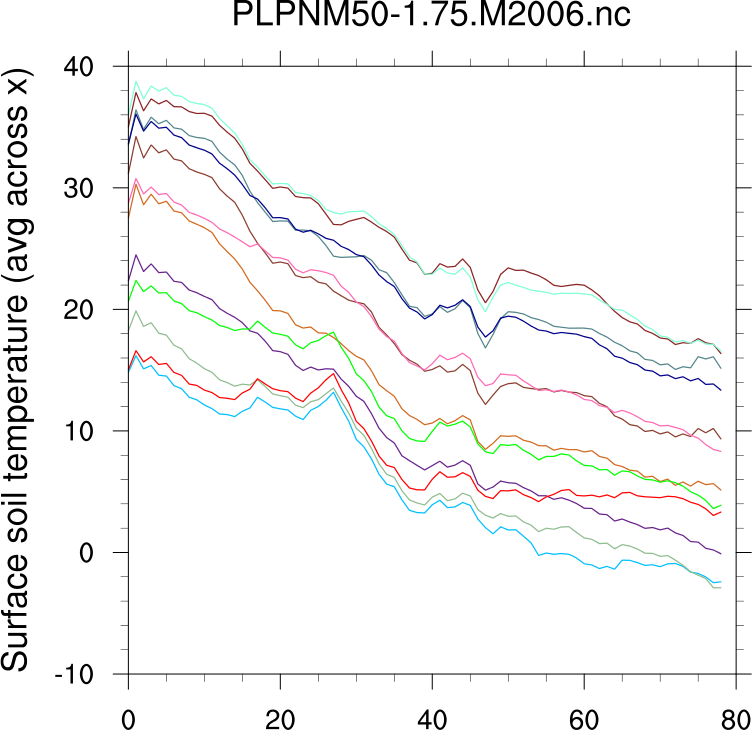
| ALADIN_tsur_avg_6.ncl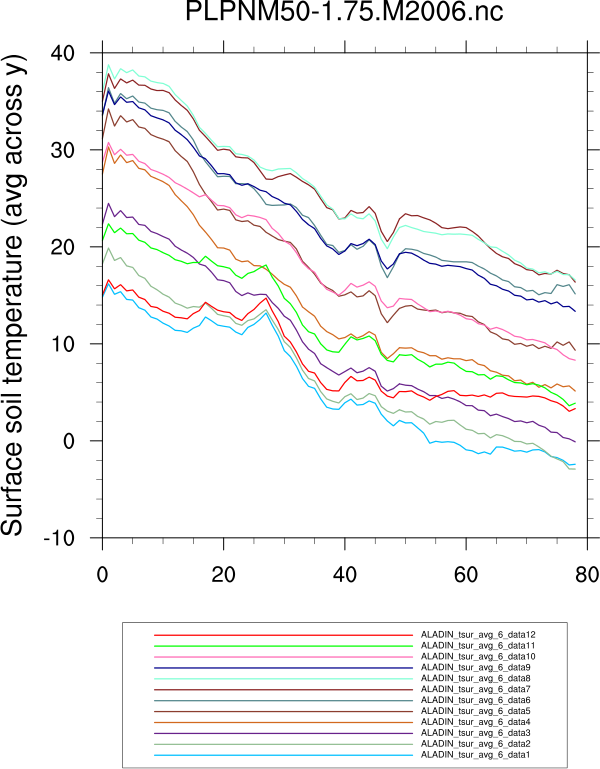
|
ALADIN_tsur_avg_7.ncl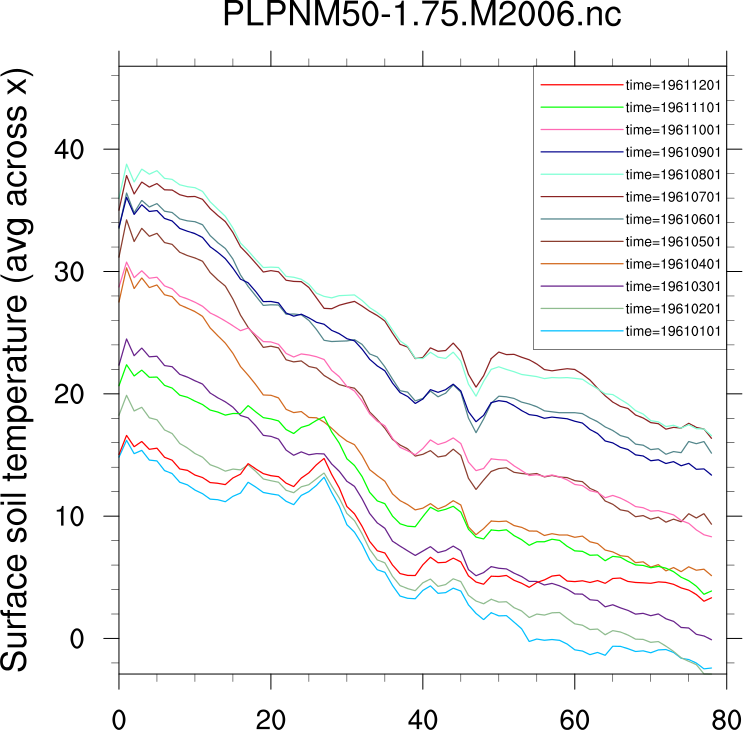
| ||
| NetCDF file used for these plots is "tas_MED-44_ERAINT_evaluation_r1i1p1_CNRM-ALADIN52_v1_mon_197901-201012.nc" provided by Samuel Somot, Météo-France. The script is based on the ALADIN_tsur_5.ncl above. | |
ALADIN_tas_5.ncl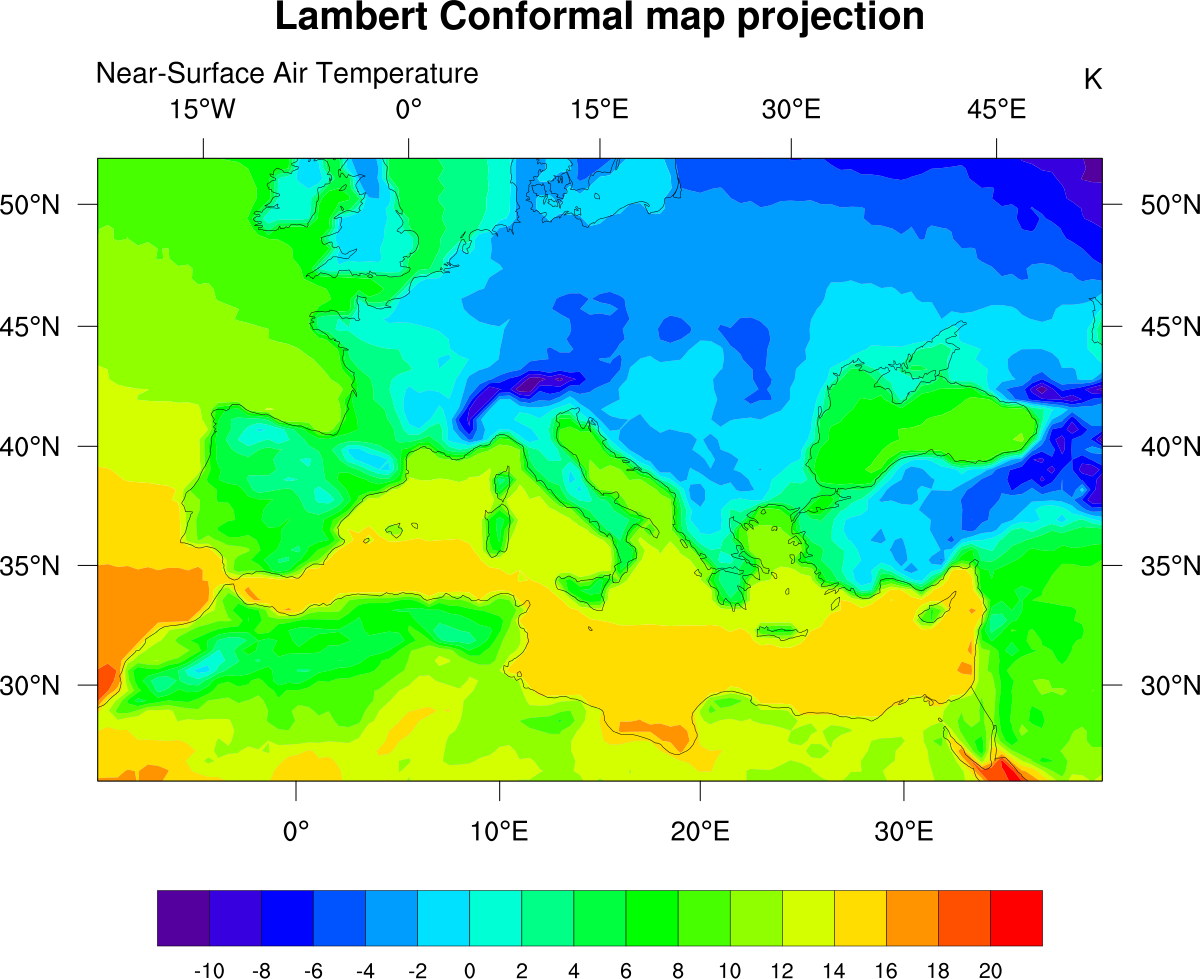
| To create a animated GIF file,
run ALADIN_tas_anim.ncl. You must
have the "convert" tool installed. A file called "ALADIN_tas_anim.gif"
will be created, which you can open with your web browser to see the
animation.
In the script, every 10th timestep is plotted. This was to keep the GIF file small. To change, simply remove the ",10" from the do loop. |
ALADIN_tsur_znew_1.ncl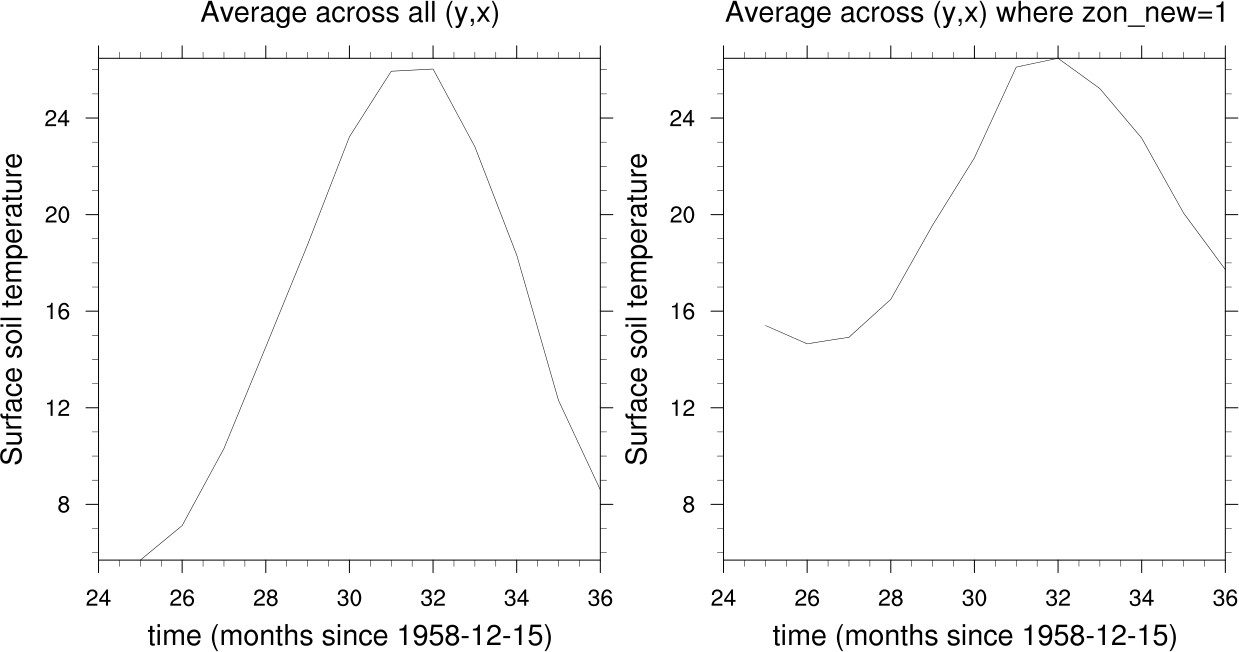
| ALADIN_tsur_znew_2.ncl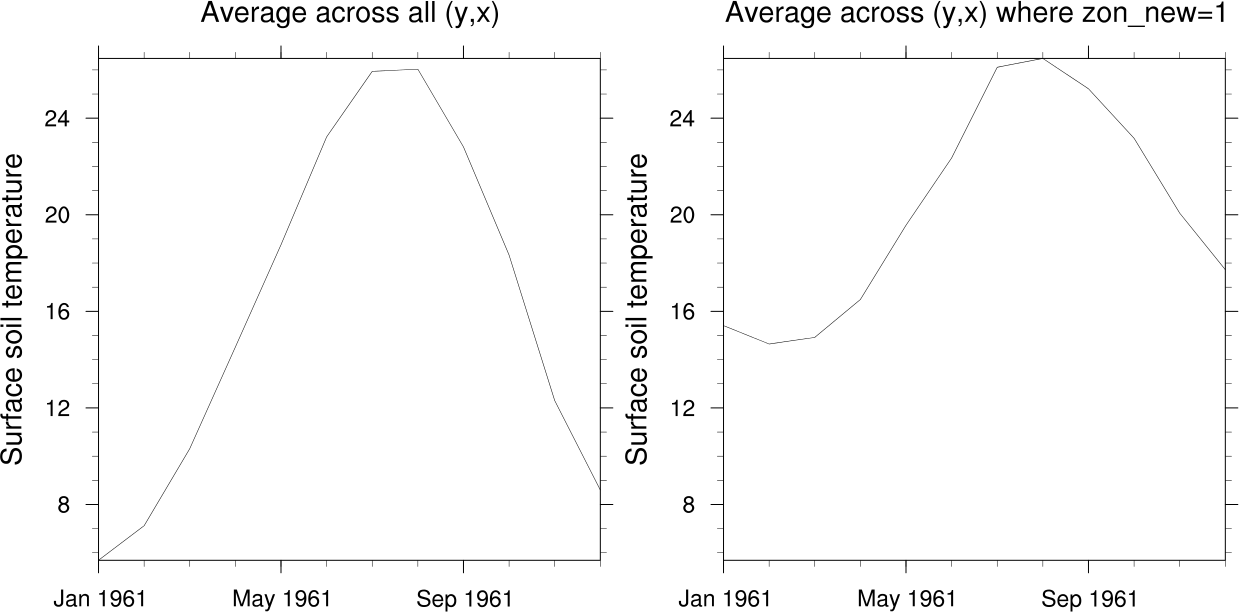
| ALADIN_tsur_znew_3.ncl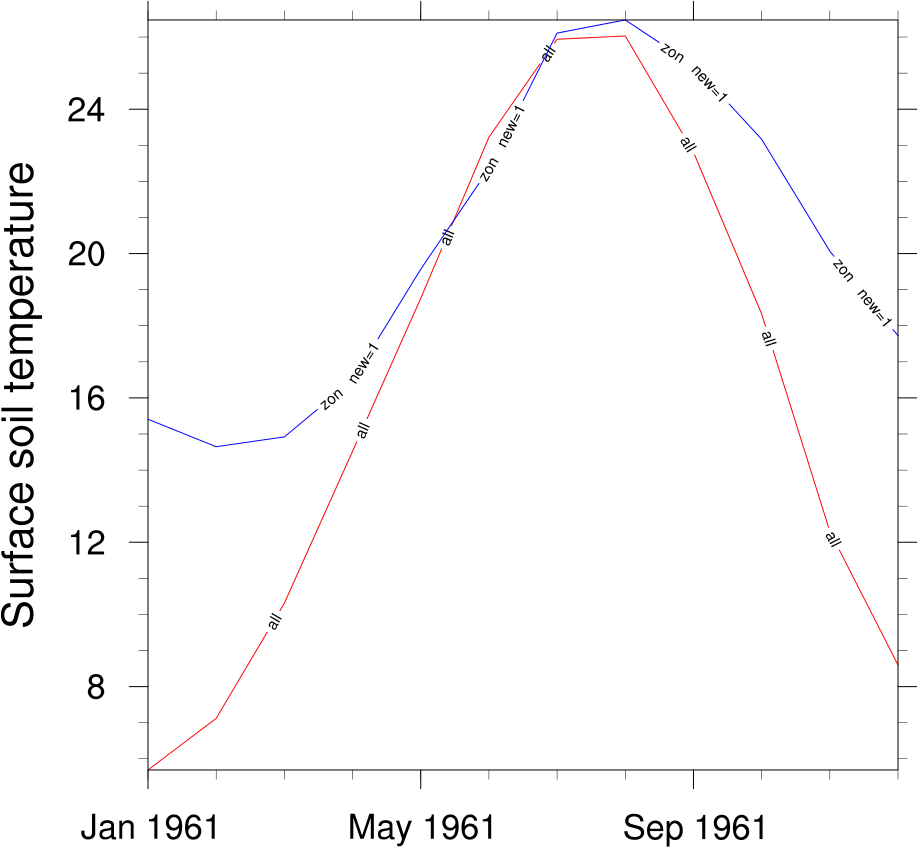
|
| Pierre Nabat of Météo-France created this script during an NCL workshop. It creates an XY plot of an average of temperature and pressure on the same axes. |
multiaxes2.ncl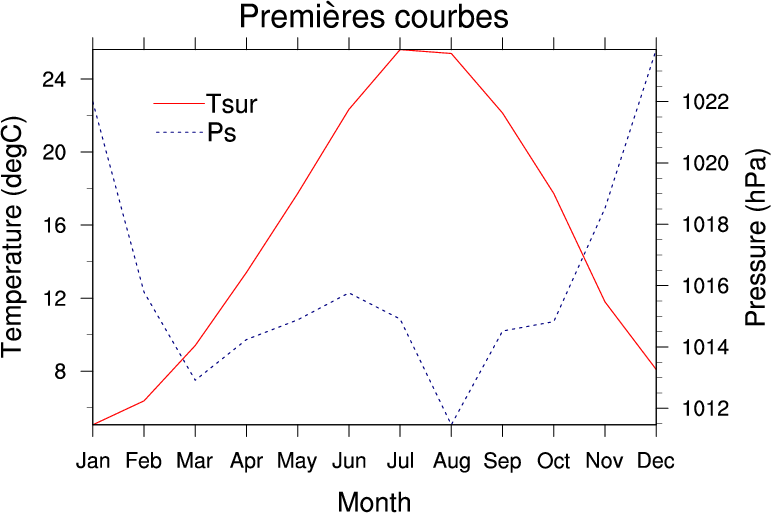
|