NCL scripts for plotting HYCOM data
[Main page | Scripts]Note: the scripts on this page are meant to be used as a set of step-by-step examples for the NCL Workshop being held at ARSC/UAF, March 11-15, 2013. Some of these scripts are very basic and not appropriate for real-world use. If you want to use the scripts on this page, we recommend using the ones with the higher numbers; for example, "vector_ocn_12.ncl" rather than "vector_ocn_1.ncl".
The NetCDF files used for these plots are "hycom-cice_ARCu0.08_035_UOA_2012010100_t0xx.nc", provided by Gregory Deemer, Dept of Atmospheric Sciences.
Some of the variables on the file have "scale_factor" and "add_offset" attributes associated with them. You need to use the special short2flt function to "unpack"these variables.
[Click on any image to see a larger version.]
| This set of examples plots "uocn", "vocn", and "hi" variables. | |||
|---|---|---|---|
vector_ocn_1.ncl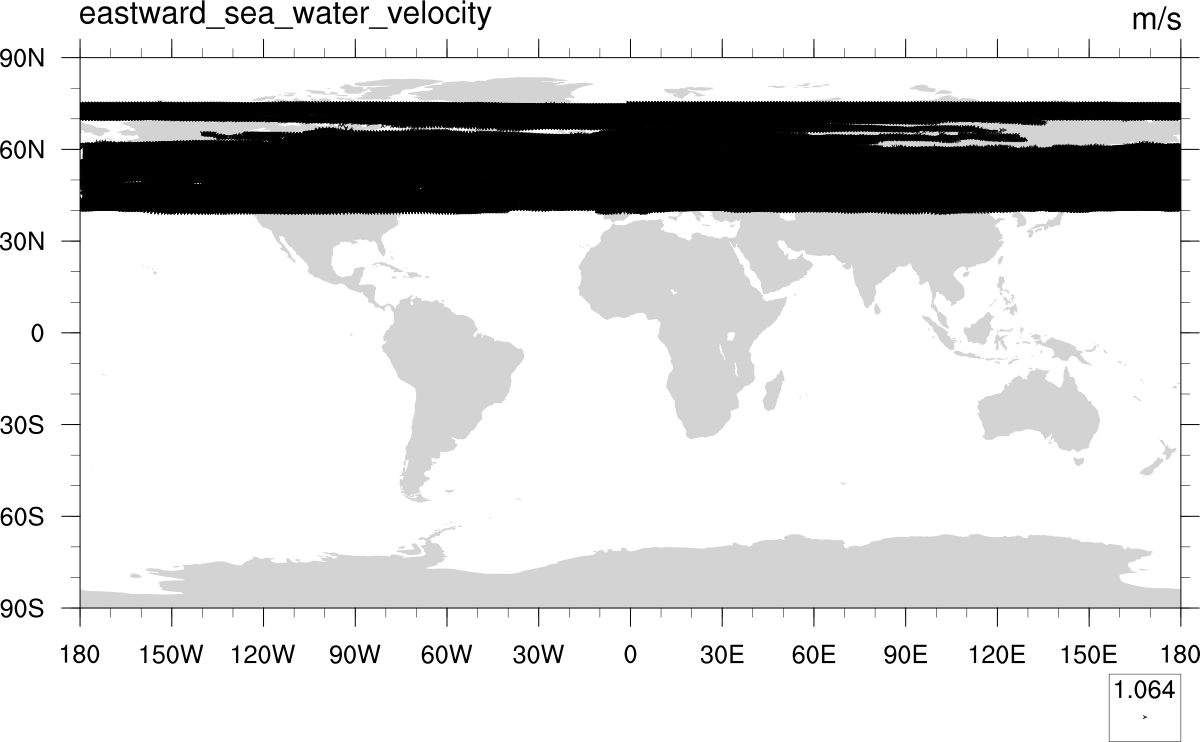 Default plot with minimal options set. | vector_ocn_2.ncl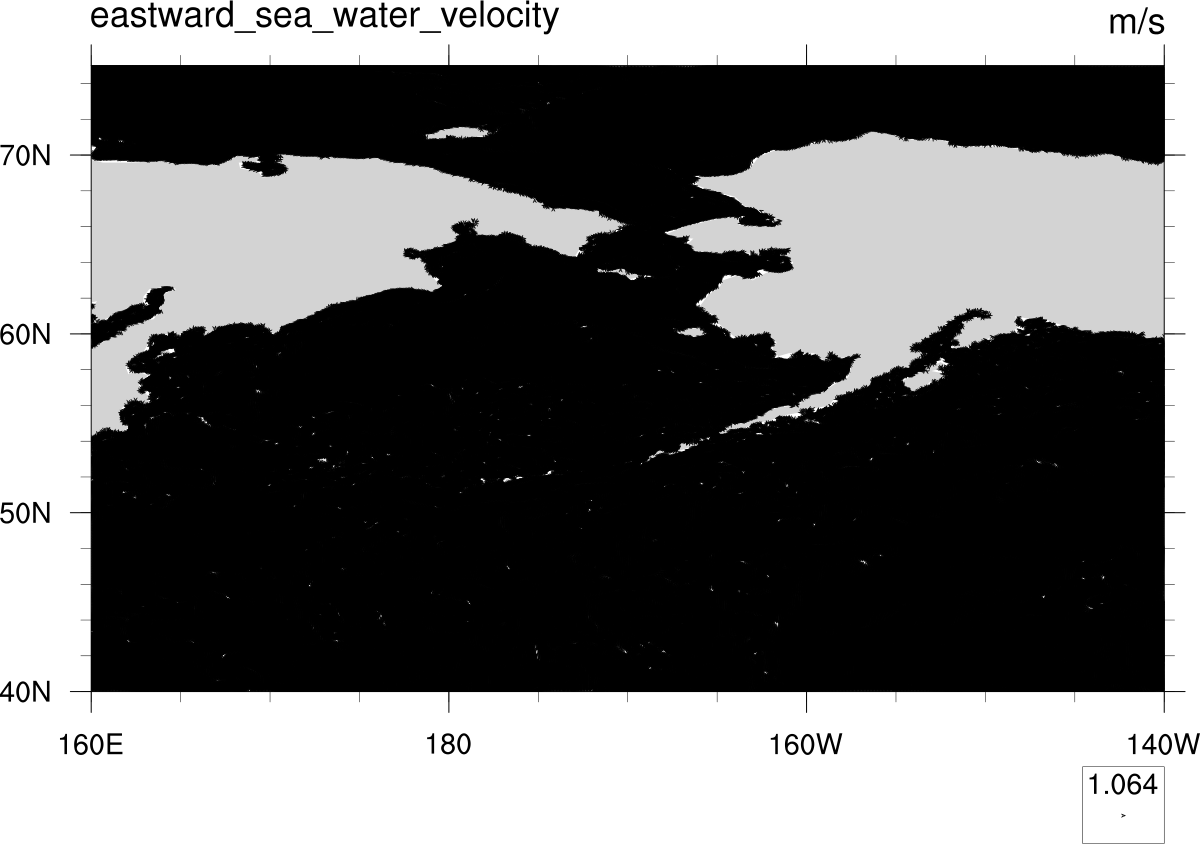 Zoom in on area of interest. | vector_ocn_3.ncl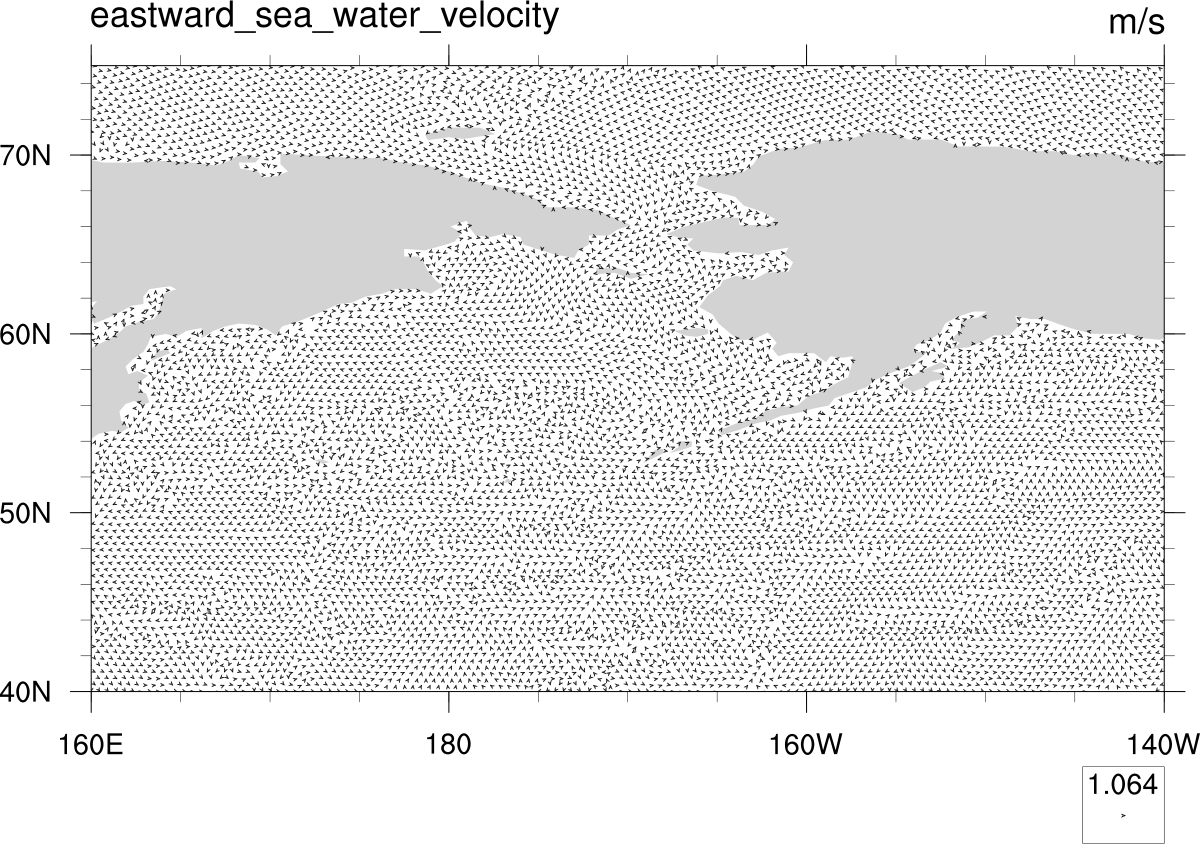 Thin the vectors. | vector_ocn_4.ncl vector_ngl_ocn_4.py 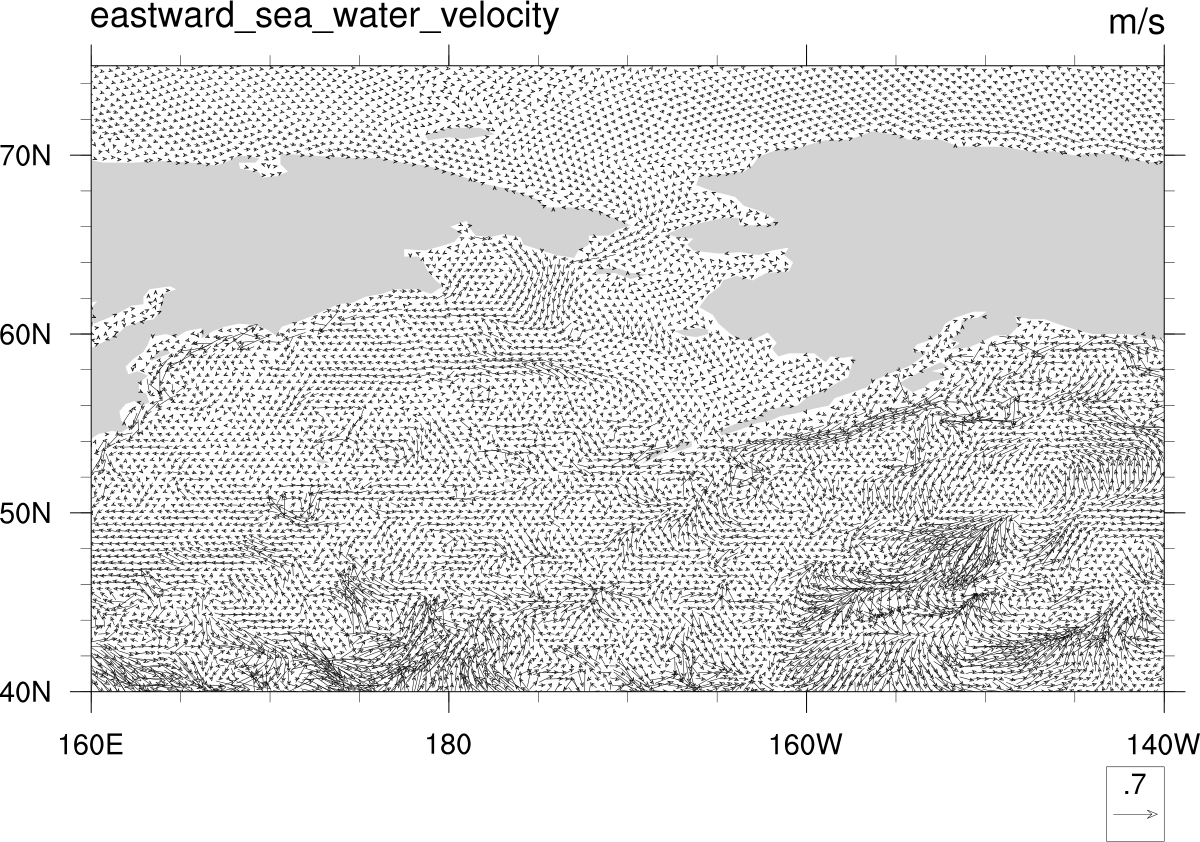 Change the length of the vectors. |
vector_ocn_5.ncl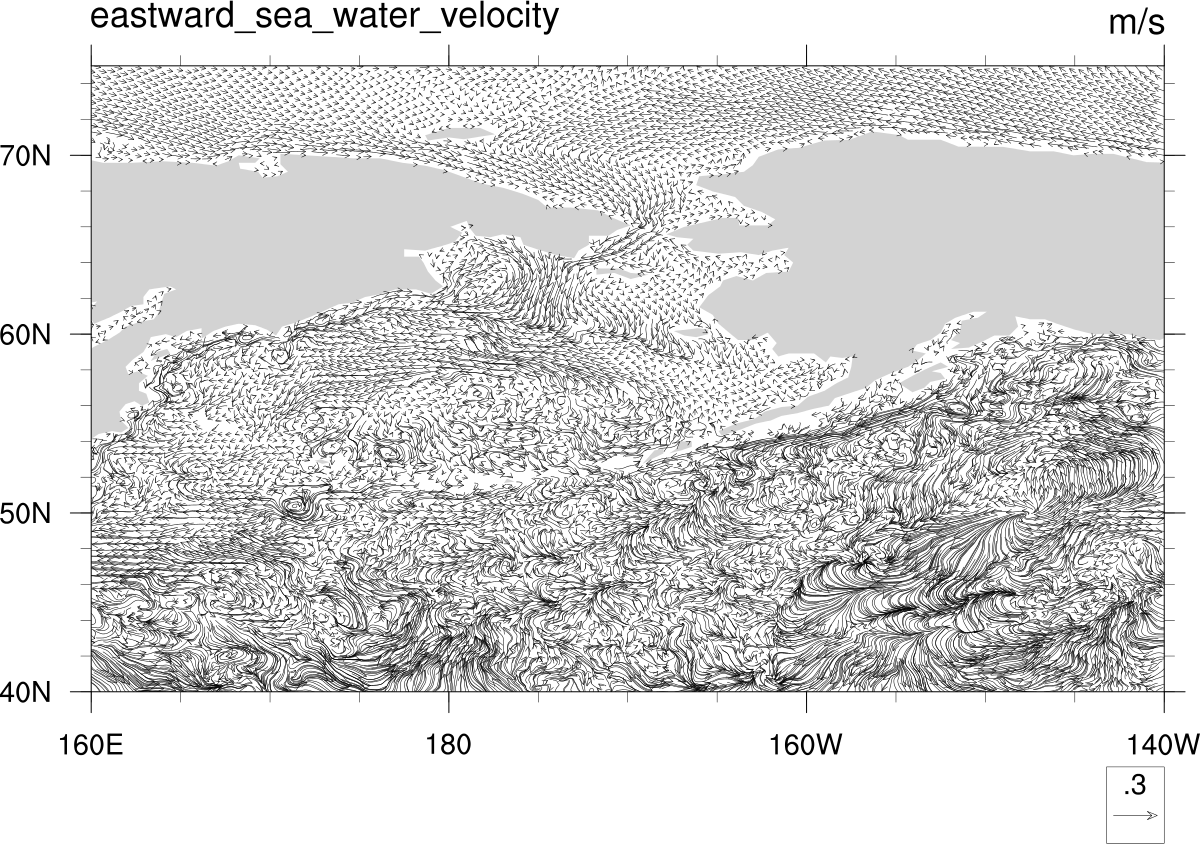 Change to curly vectors. | vector_ocn_6.ncl Change the length of the vectors again. | vector_ocn_7.ncl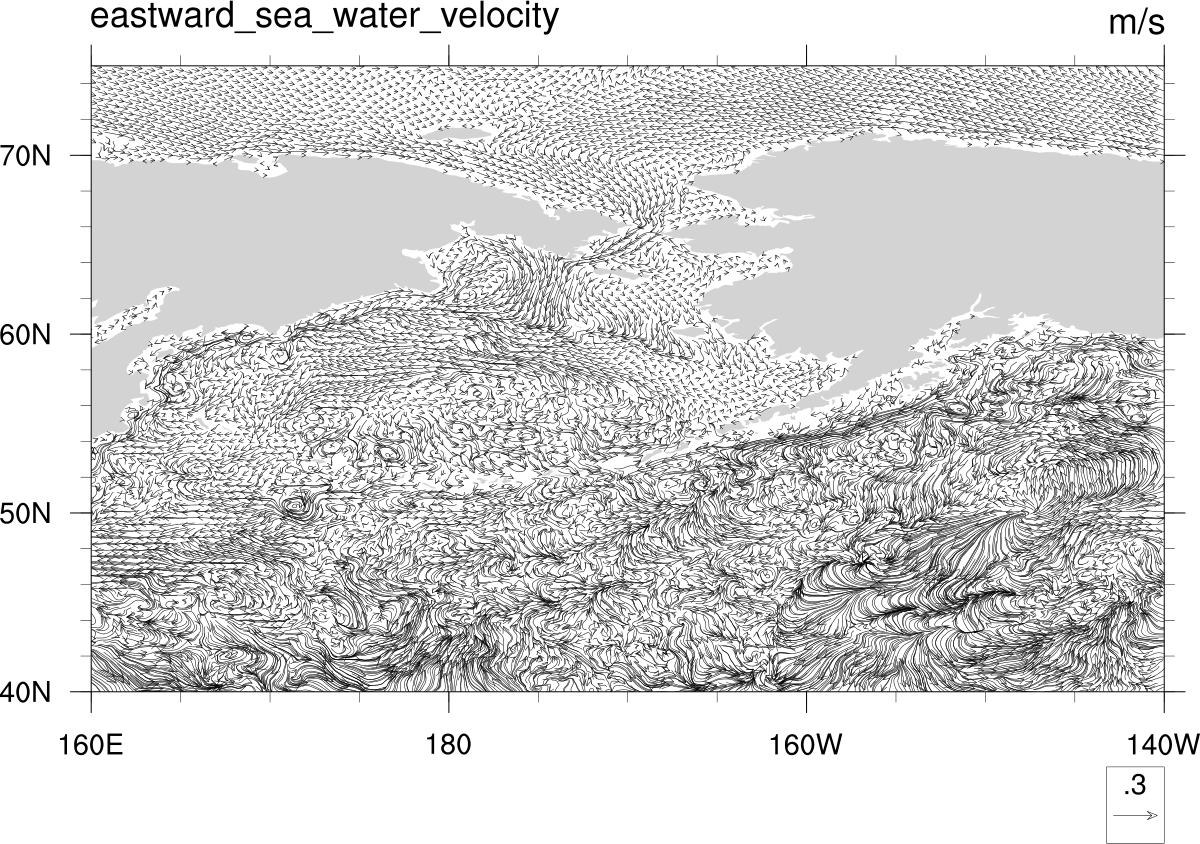 Use the medium resolution map database. | vector_ocn_8.ncl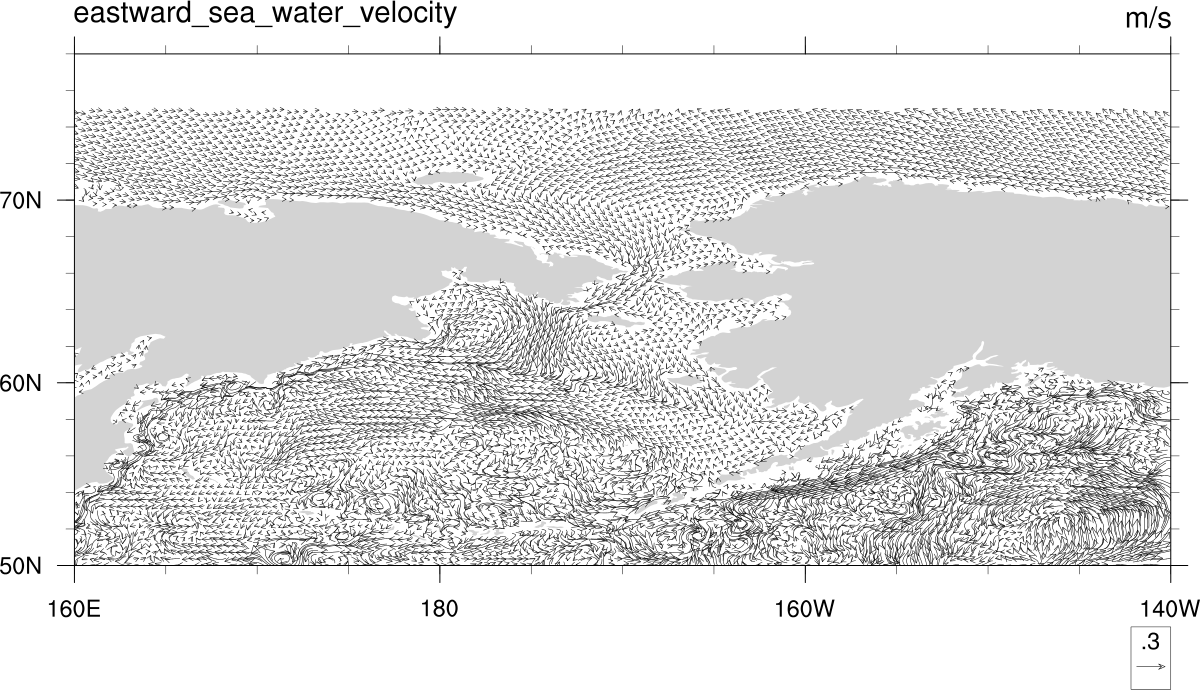 Zoom in further on map. |
vector_ocn_9.ncl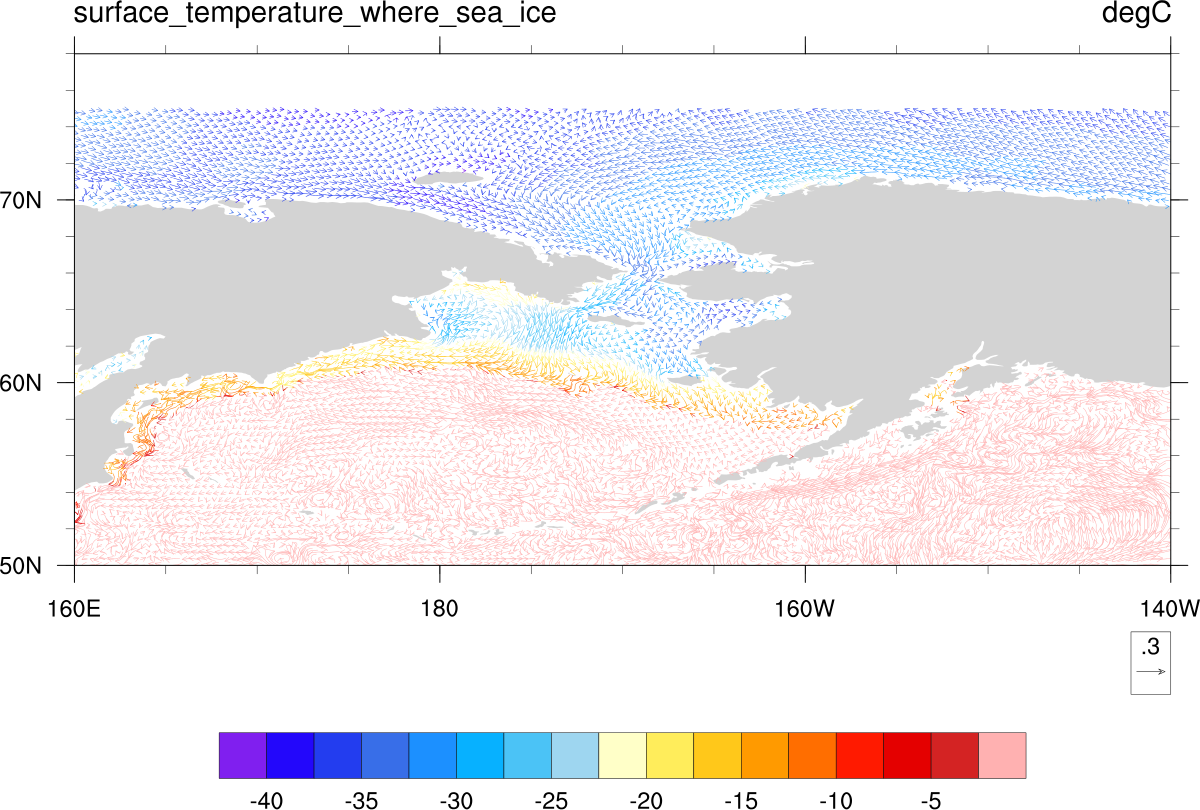 Color the vectors by a third field (temperature). | vector_ocn_10.ncl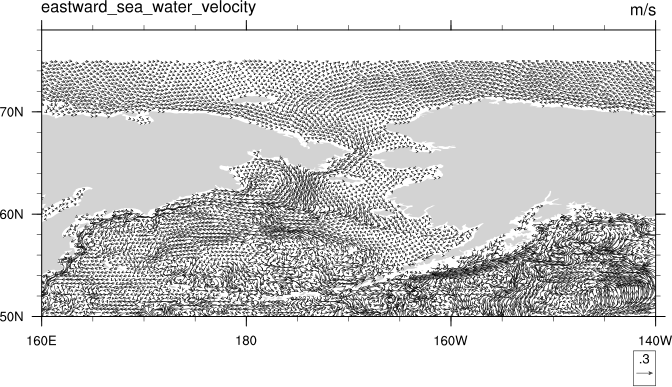 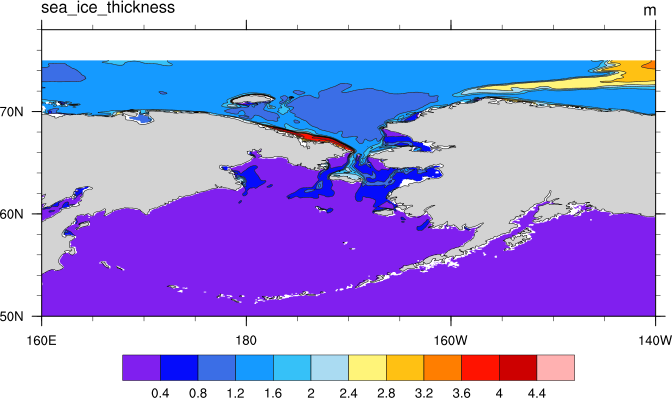 Draw a second color contour plot of ice thickness. | vector_ocn_11.ncl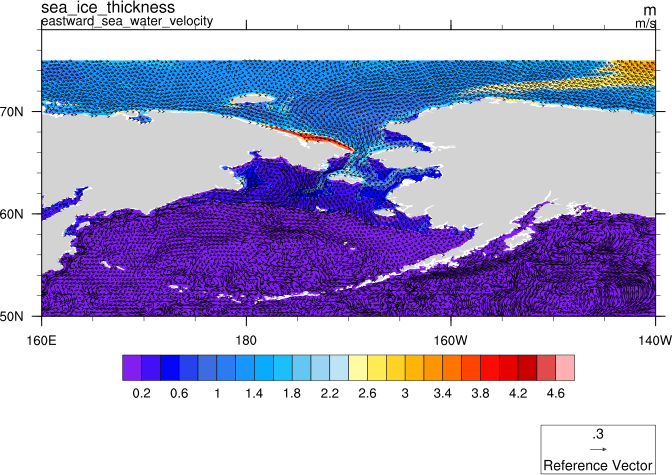 Draw the vectors on top of color contours of ice thickness. | vector_ocn_12.ncl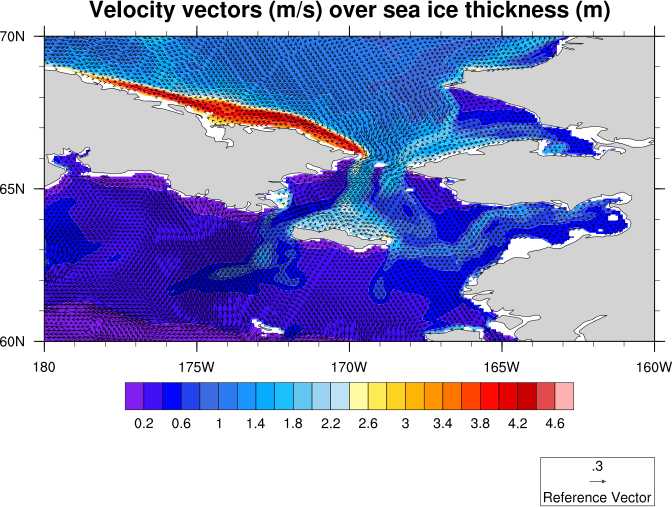 Zoom in on map again; clean up titles. |
vector_ocn_13.ncl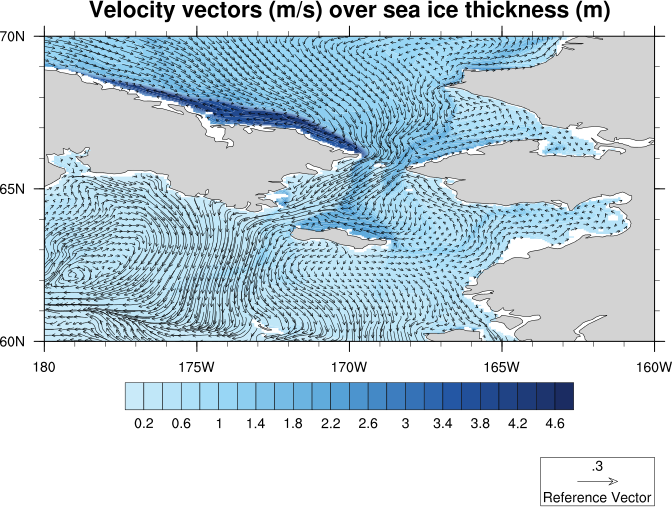 Change the color map used for the contours. | vector_ocn_14.ncl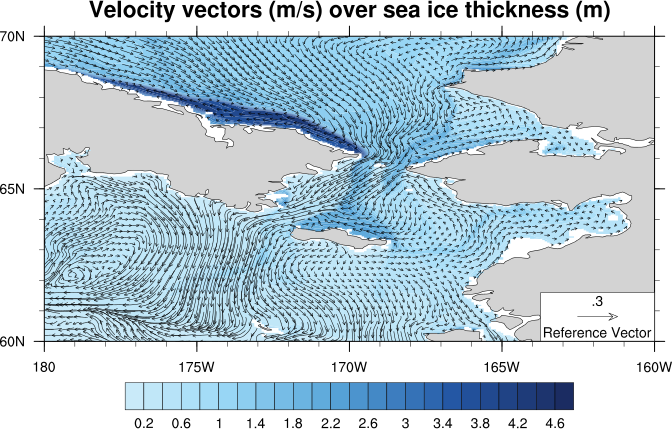 Move the vector annotation box into the plot. | vector_ngl_ocn_14.py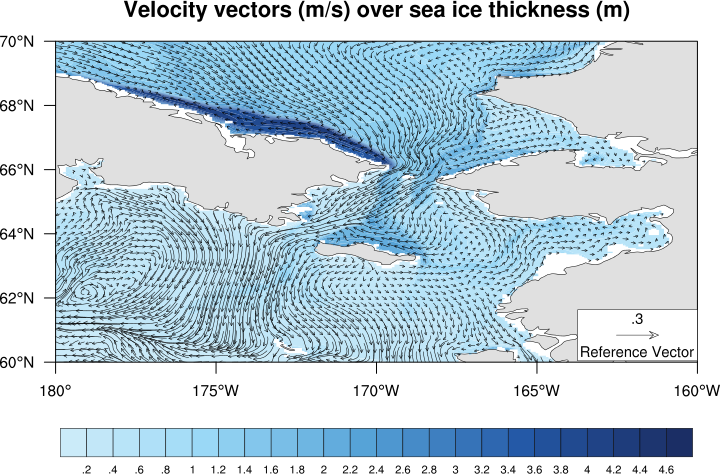 (Roughly same plot using PyNGL and PyNIO.) | |
| This set of examples plots the "hs" variable from all six files. | |||
|---|---|---|---|
contour_hs_1.ncl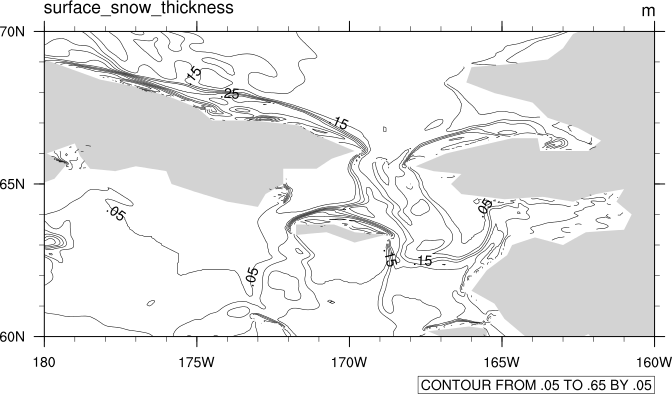 Draw simple line contours of surface snow thickness. | contour_hs_2.ncl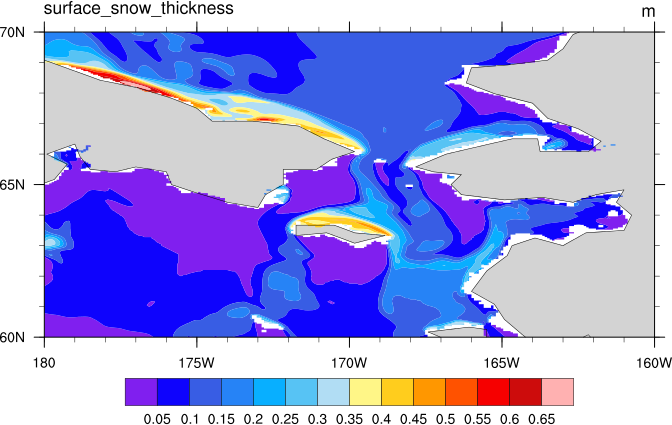 Draw filled contours of surface snow thickness. | contour_hs_3.ncl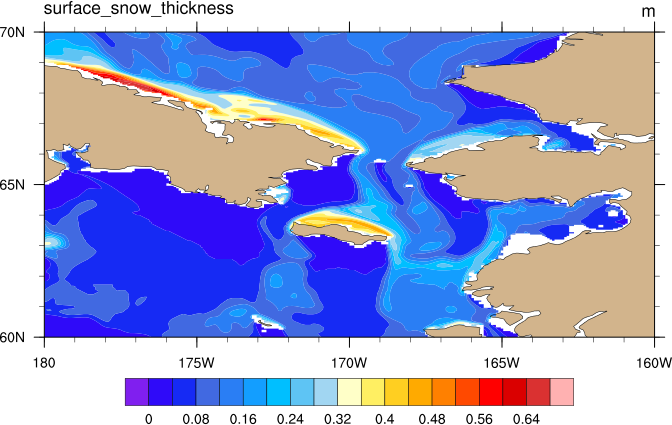 Change contour levels; color land with "tan", medium resolution map outlines. | contour_hs_4.ncl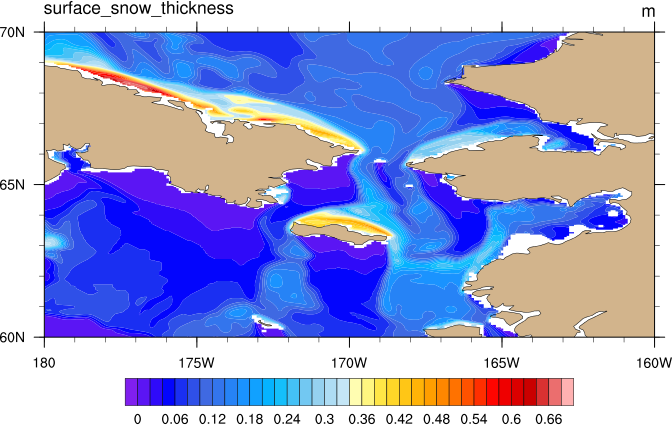 Change the contour level spacing. |
contour_hs_5.ncl Create six contour plots (only one shown here). | contour_hs_6.ncl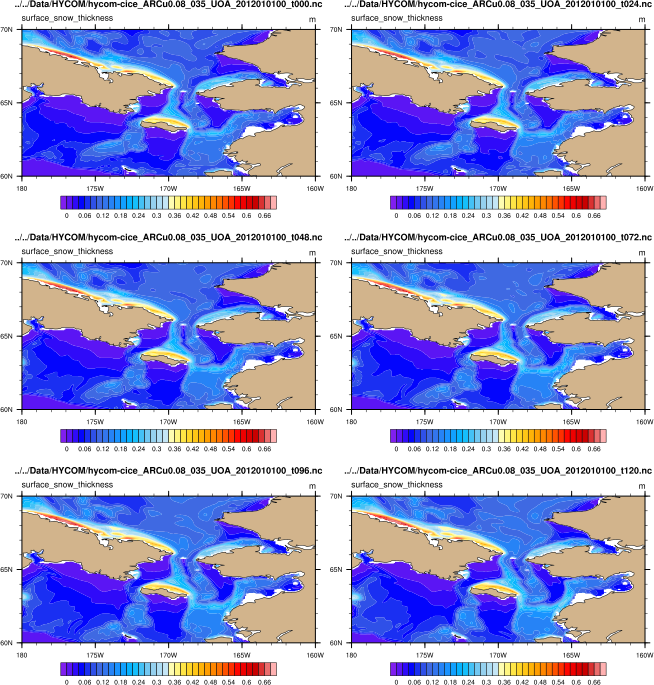 Panel six contour plots on one page. | contour_hs_7.ncl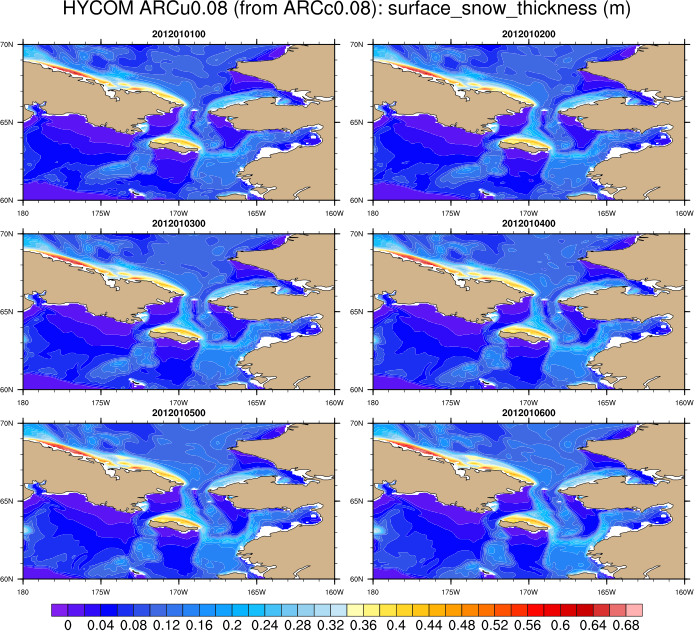 Add a common labelbar and title to the paneled plots. | |
| This set of examples plots "uvel" and "vvel". | |||
|---|---|---|---|
vector_vel_1.ncl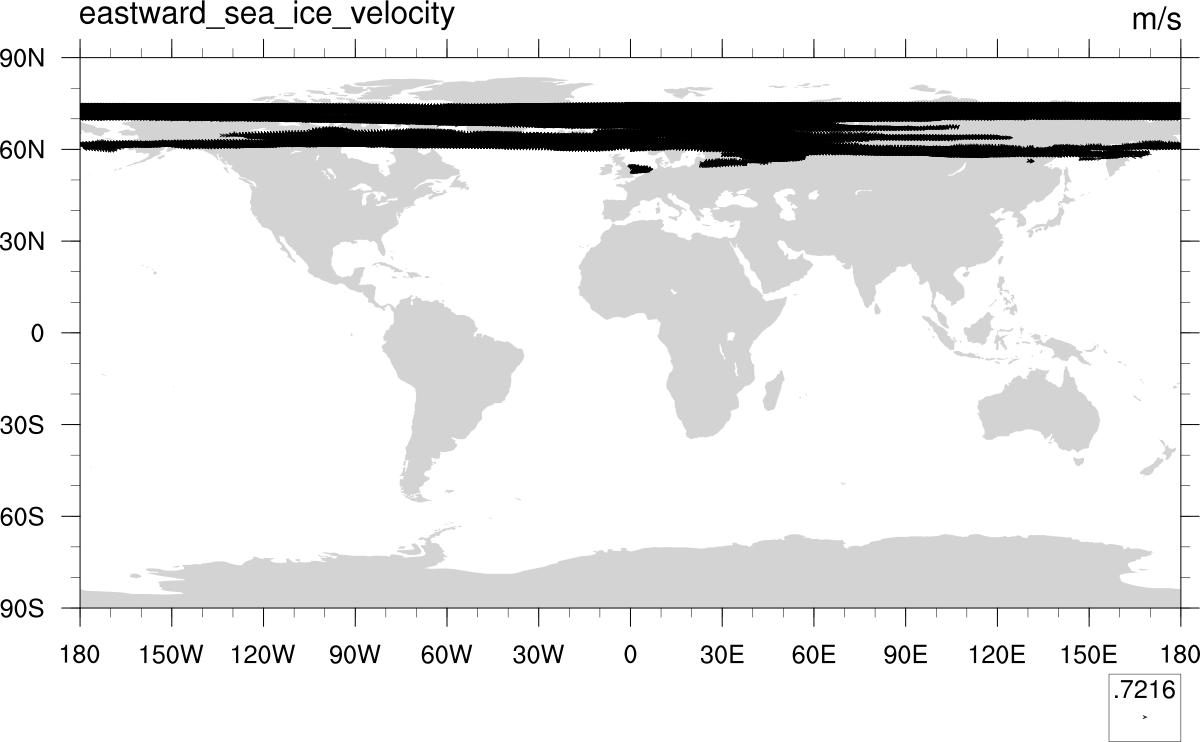
| vector_vel_2.ncl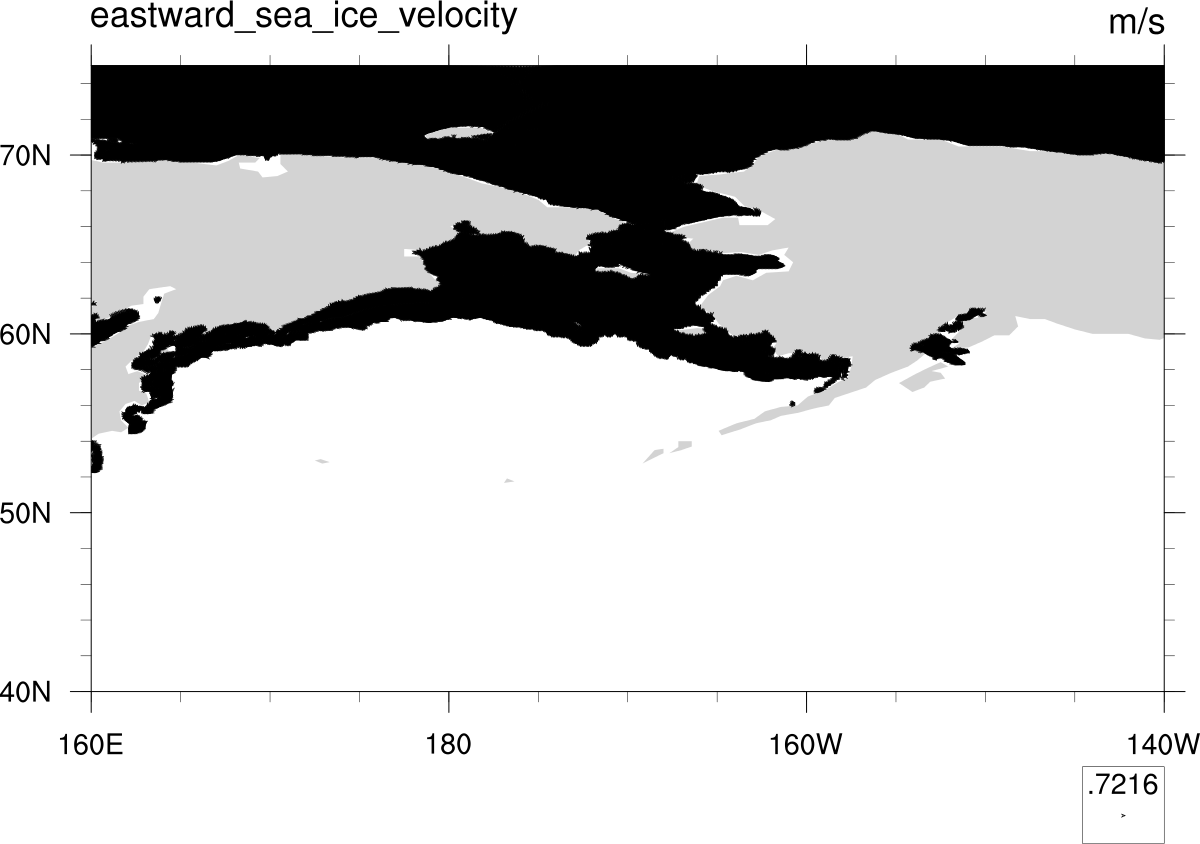
| vector_vel_3.ncl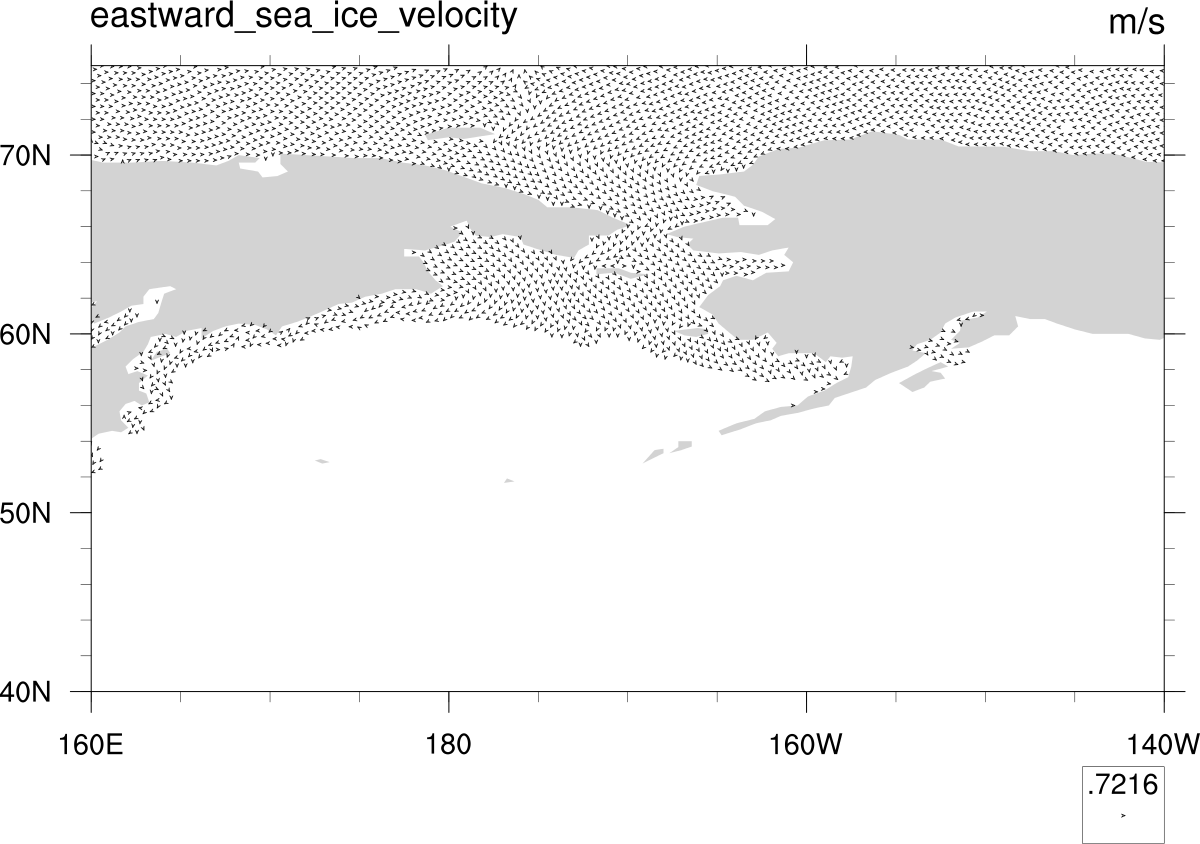
| vector_vel_4.ncl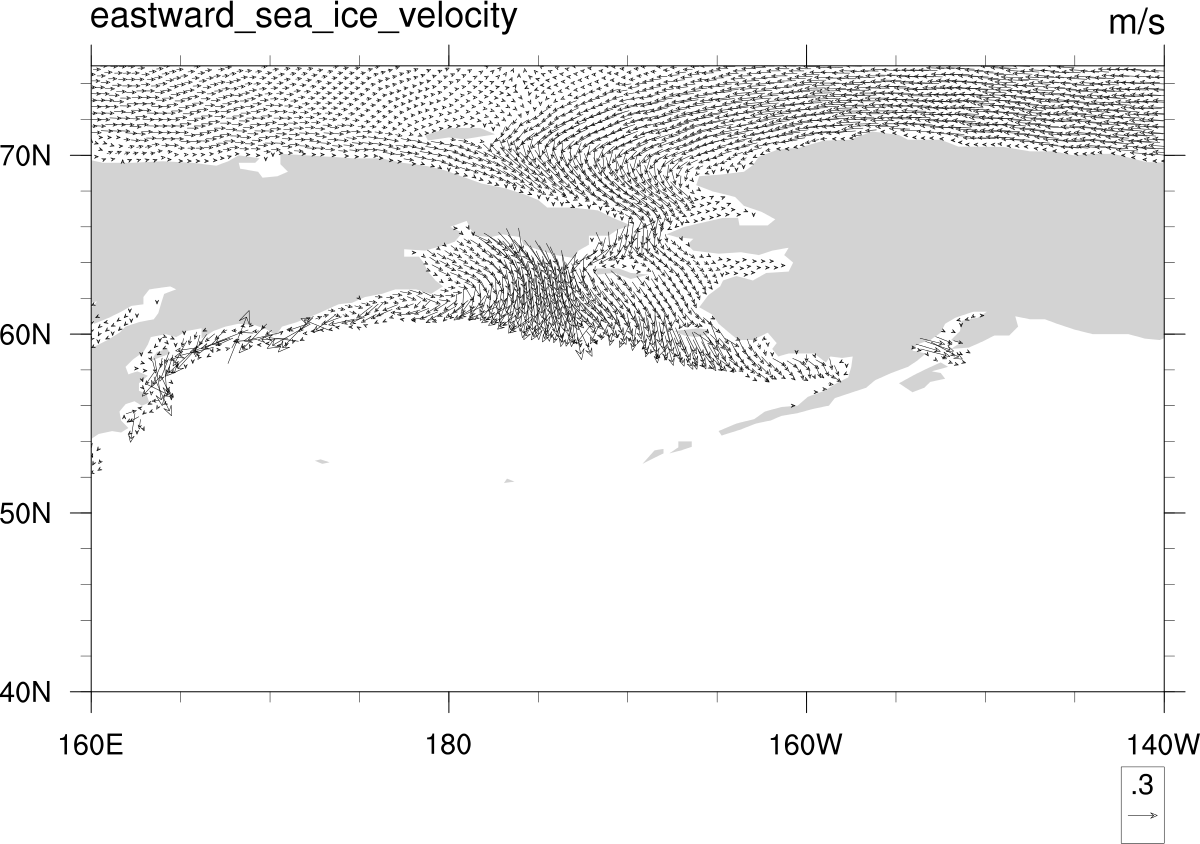
|
vector_vel_5.ncl
| vector_vel_6.ncl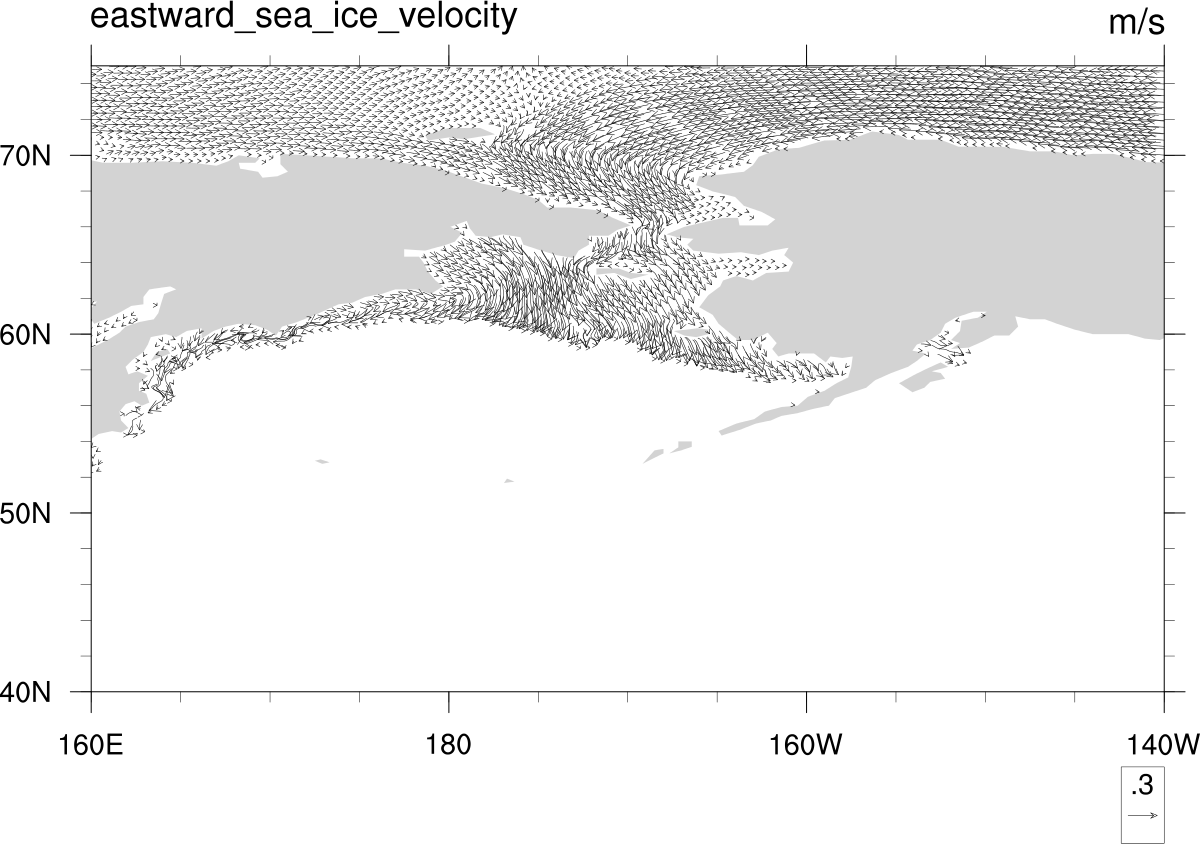
| vector_vel_7.ncl
| vector_vel_8.ncl
|